USD CAD in focus ahead of data holding above key support
Yesterday saw the USD/CAD arrive at and then bounce from a major technical support level of 1.2835 after its recent retreat from a major Fibonacci exhaustion area. What it does next could determine the direction for the next several days at the very least, though we may have potentially already seen the top for the Loonie.
In truth, a lot will depend on the direction of oil prices, with crude being Canada’s number one commodity export. Oil actually managed to bounce back strongly late Thursday as traders shrugged off news of a sharp 7.6 million-barrel-increase in US oil stocks, blaming seasonal factors behind the build. The devil was in the detail of the report, which among other things revealed some bullish factors: a decrease in oil products – gasoline and distillates – and a small fall in production. Oil also got a lift from speculation that Russia is ready to talk with the OPEC about a possible production cut. Though crude may be slightly lower today and has given up most of its sharp gains from the previous week, there is still the possibility that a bottom was hit in August. If this is correct, there is a good chance the USD/CAD currency pair may have peaked at 1.3455 at the end of September.
In addition to oil prices, traders will need to watch the incoming macroeconomic data from North America. US numbers have recently hit a soft patch, causing investors to push back their Federal Reserve rate hike expectations. Further deterioration in US data in particular will be bad news for the USD/CAD. Today’s numbers include Industrial Production, Capacity Utilization, UoM Consumer Sentiment, JOLTS Job Openings and TIC Long-Term Purchases. Ahead of these numbers, we will have a couple of Canadian figures at 13:30 BST: Manufacturing Sales and Foreign Securities Purchases.
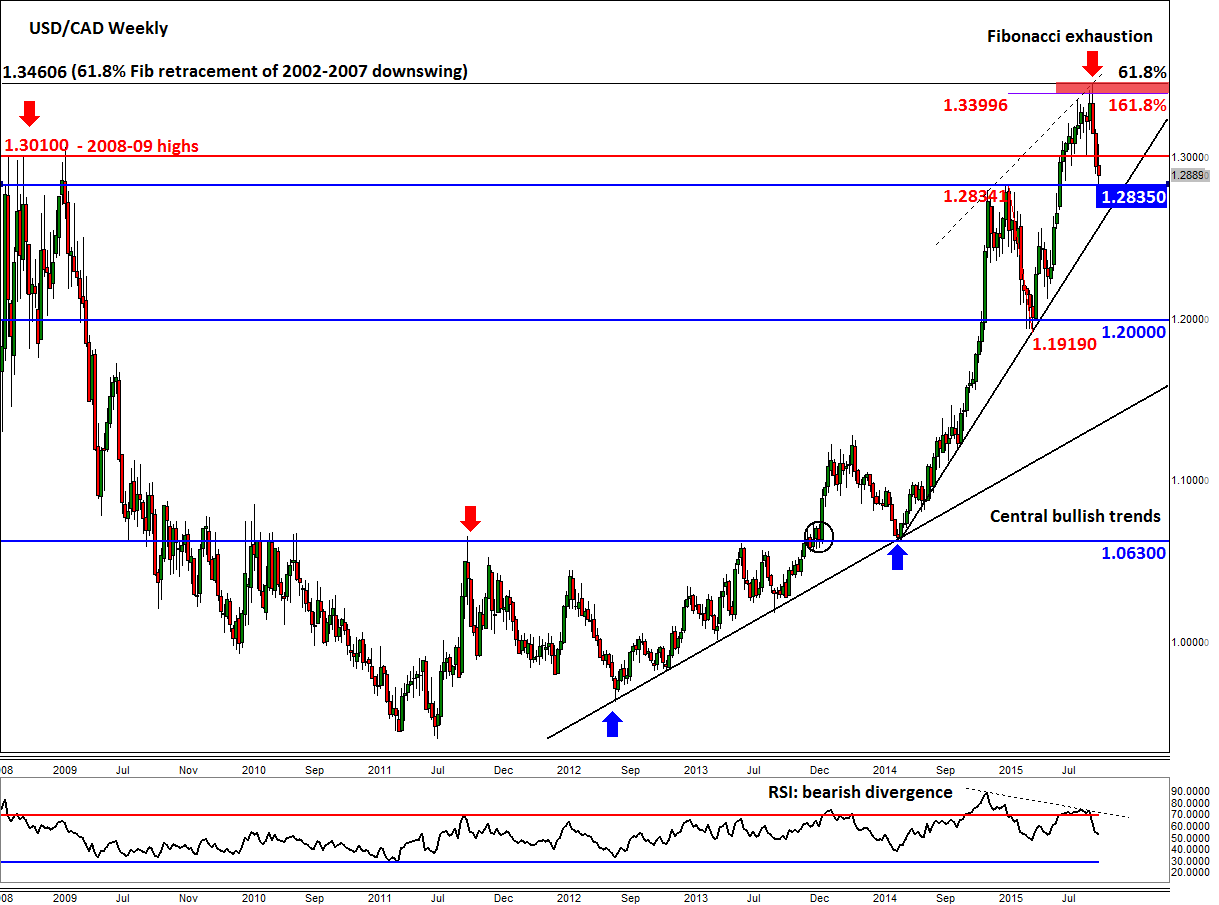
Turning our attention to the technical side of things and there a few interesting developments to take into account. We will begin by looking at the weekly chart, in figure 1. As can be seen, the USD/CAD hit a Fibonacci exhaustion area around 1.3400/60 at the end of September before retreating sharply. This area corresponds with the 61.8% retracement level of the entire 2002-2007 bear trend and the 161.8% extension level of the most recent downswing. The weekly chart also reveals a clear bearish divergence on the RSI momentum indicator, confirming that the bullish momentum was weakening as price approached that exhaustion level. In addition, the Loonie is failing to hold above the 2008/2009 highs of 1.3000/10 which is a further bearish development.
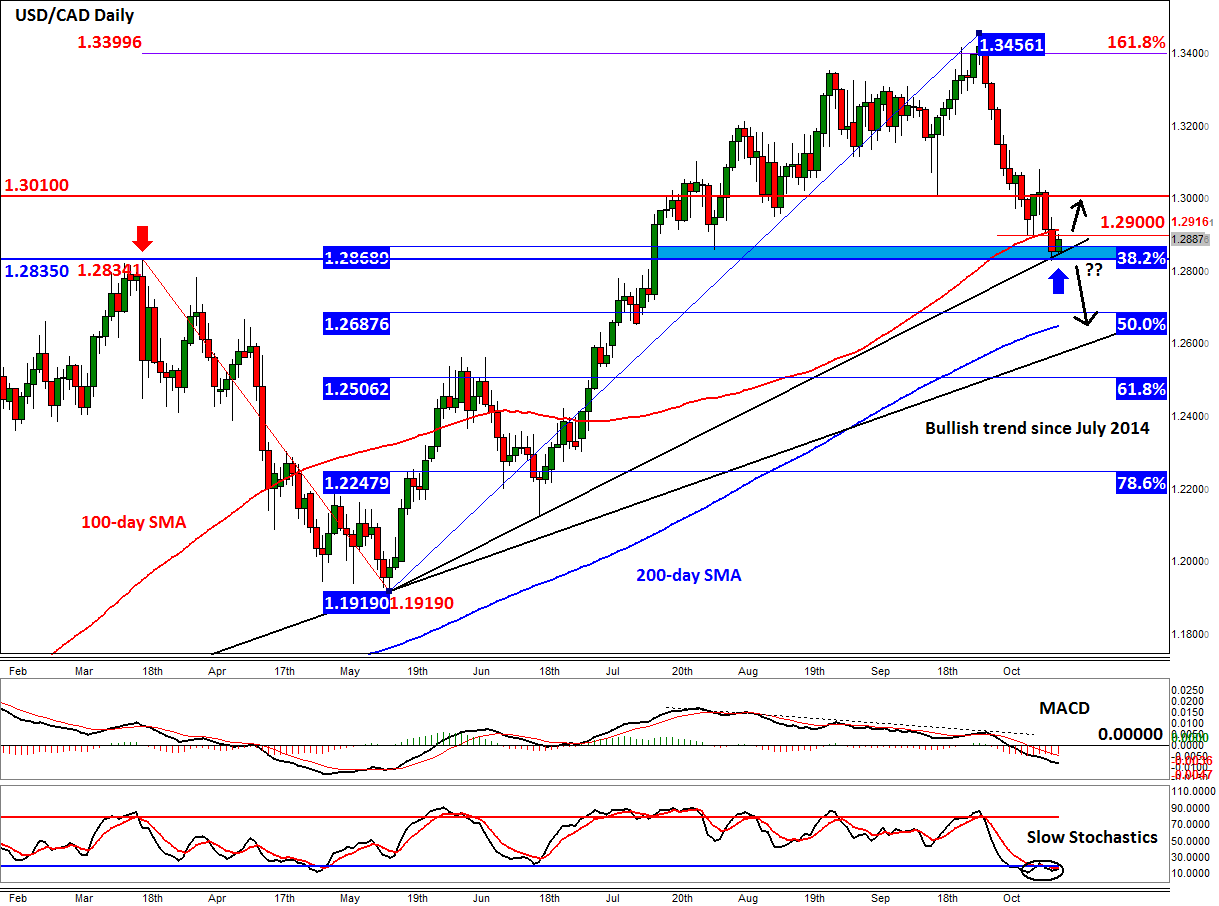
BUT so far the previous resistance and medium term bullish trend line at 1.2830/5 has been defended successfully, as shown on the daily chart. The USD/CAD is now testing the prior support and 100-day moving average around 1.2900. A decisive break above here could see price rally back to 1.3010 before deciding on its next move. The secondary momentum indicators on the daily chart show mixed signals: the MACD is trending below both the signal line and zero, which is bearish, while the slow stochastics point to oversold conditions.
The bears meanwhile will need the USD/CAD to break below the abovementioned support at 1.2830/5 in order to grow more in confidence. If seen, the Loonie may initially drop to the 200-day moving average, currently at 1.2650, before deciding on its next move. Just below this moving average resides the long-term bullish trend line that goes back to July of last year, around 1.2600. Thereafter is the 61.8% Fibonacci retracement level of the last upswing at 1.2505. These levels will be among the short-term bearish targets that we will be watching closely in case the USD/CAD breaks down.
StoneX Financial Ltd (trading as “City Index”) is an execution-only service provider. This material, whether or not it states any opinions, is for general information purposes only and it does not take into account your personal circumstances or objectives. This material has been prepared using the thoughts and opinions of the author and these may change. However, City Index does not plan to provide further updates to any material once published and it is not under any obligation to keep this material up to date. This material is short term in nature and may only relate to facts and circumstances existing at a specific time or day. Nothing in this material is (or should be considered to be) financial, investment, legal, tax or other advice and no reliance should be placed on it.
No opinion given in this material constitutes a recommendation by City Index or the author that any particular investment, security, transaction or investment strategy is suitable for any specific person. The material has not been prepared in accordance with legal requirements designed to promote the independence of investment research. Although City Index is not specifically prevented from dealing before providing this material, City Index does not seek to take advantage of the material prior to its dissemination. This material is not intended for distribution to, or use by, any person in any country or jurisdiction where such distribution or use would be contrary to local law or regulation.
For further details see our full non-independent research disclaimer and quarterly summary.
CFDs are complex instruments and come with a high risk of losing money rapidly due to leverage. 69% of retail investor accounts lose money when trading CFDs with this provider. You should consider whether you understand how CFDs work and whether you can afford to take the high risk of losing your money. CFD and Forex Trading are leveraged products and your capital is at risk. They may not be suitable for everyone. Please ensure you fully understand the risks involved by reading our full risk warning.
City Index is a trading name of StoneX Financial Ltd. Head and Registered Office: 1st Floor, Moor House, 120 London Wall, London, EC2Y 5ET. StoneX Financial Ltd is a company registered in England and Wales, number: 05616586. Authorised and regulated by the Financial Conduct Authority. FCA Register Number: 446717.
City Index is a trademark of StoneX Financial Ltd.
The information on this website is not targeted at the general public of any particular country. It is not intended for distribution to residents in any country where such distribution or use would contravene any local law or regulatory requirement.
© City Index 2024