USD CAD Canadian jobs show under the surface strength
While not nearly as widely-watched as the US version (NFP), Canada’s jobs report can nonetheless be a big market mover, especially for the loonie. Unfortunately for this month’s iteration, the headline reading came in largely as expected: the Canadian economy lost 6.4k jobs in June, roughly in line with the market’s forecast of a 9k decrease in employment. Of course, this month’s report comes in the wake of the stellar May employment report, when a whopping 59k jobs were created in the Great White North.
Digging a little deeper reveals a nuanced picture of the Canadian labor market. The unemployment rate did tick down by 0.1% to 6.8%, but this drop was driven by a falling participation rate (from 65.9% to 65.8%) rather than a strong job growth (as we noted above). That said, the economy actually created 64.8k full-time jobs in June, with the overall negative print caused by a larger drop in part-time employment. Intuitively, the increase in full-time jobs at the expense of part-time jobs creates a more solid base for future economic growth and consumer spending; in other words, the quality of the jobs created was strong, partially offsetting the decline in the quantity of jobs.
Technical view: USD/CAD
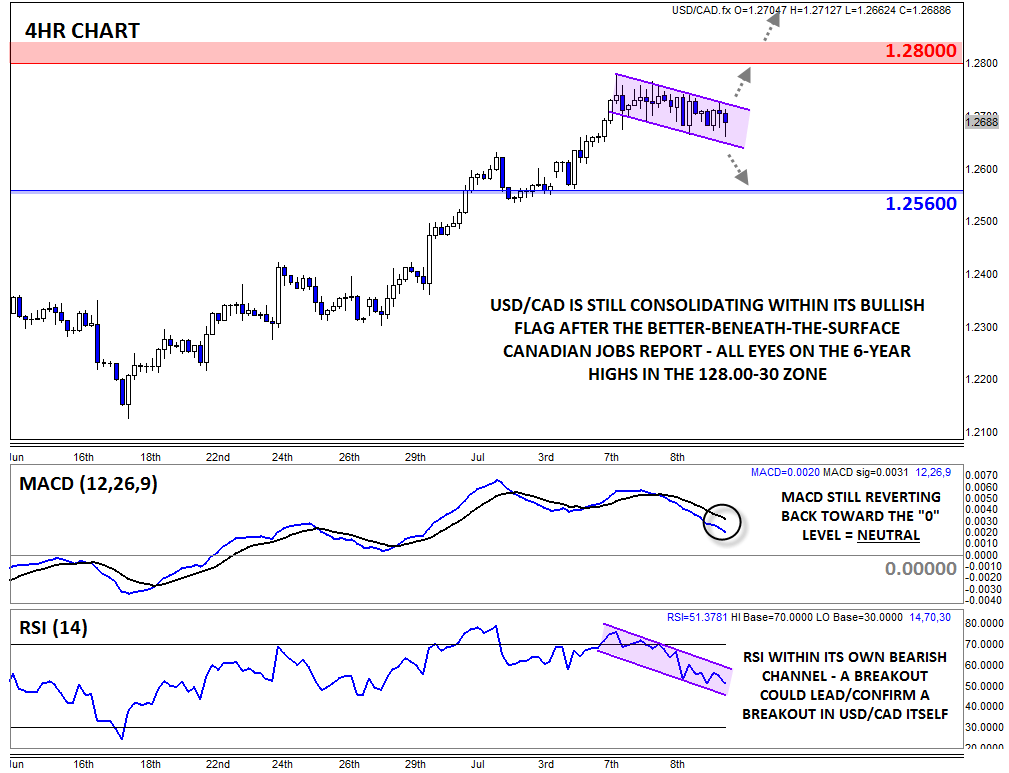
USD/CAD has seen only a minimal reaction to today’s jobs report, with the pair edging about 20 pips lower in the wake of the release. Taking a step back, rates remain solidly in the middle of the recent consolidation zone, which some traders are viewing as a bullish flag pattern. As a reminder, this pattern is created by a strong rally, followed by a shallow, controlled pullback and, despite its name, it is only seen as a bullish if we see a breakout above the top of the flag around 127.50.
For now, more consolidation looks likely as traders await more clarity in the ongoing negotiations in Greece and Iran (with obvious implications for oil, which is Canada’s largest export). The MACD continues to revert back to the “0” level and the RSI indicator is pulling back within its own near-term bearish channel, so astute traders will be watching for a breakout in the indicator’s pattern to lead or confirm a breakout in price itself. If we do see a rally above 127.50, the 6-year high in the 128.00-30 zone may still cap rates, though a move through that resistance zone could expose the 11-year high near 1.30 next. Meanwhile, a bearish breakdown would open the door for a pullback to previous-resistance-turned-support at 1.2560 next.
StoneX Financial Ltd (trading as “City Index”) is an execution-only service provider. This material, whether or not it states any opinions, is for general information purposes only and it does not take into account your personal circumstances or objectives. This material has been prepared using the thoughts and opinions of the author and these may change. However, City Index does not plan to provide further updates to any material once published and it is not under any obligation to keep this material up to date. This material is short term in nature and may only relate to facts and circumstances existing at a specific time or day. Nothing in this material is (or should be considered to be) financial, investment, legal, tax or other advice and no reliance should be placed on it.
No opinion given in this material constitutes a recommendation by City Index or the author that any particular investment, security, transaction or investment strategy is suitable for any specific person. The material has not been prepared in accordance with legal requirements designed to promote the independence of investment research. Although City Index is not specifically prevented from dealing before providing this material, City Index does not seek to take advantage of the material prior to its dissemination. This material is not intended for distribution to, or use by, any person in any country or jurisdiction where such distribution or use would be contrary to local law or regulation.
For further details see our full non-independent research disclaimer and quarterly summary.
CFDs are complex instruments and come with a high risk of losing money rapidly due to leverage. 69% of retail investor accounts lose money when trading CFDs with this provider. You should consider whether you understand how CFDs work and whether you can afford to take the high risk of losing your money. CFD and Forex Trading are leveraged products and your capital is at risk. They may not be suitable for everyone. Please ensure you fully understand the risks involved by reading our full risk warning.
City Index is a trading name of StoneX Financial Ltd. Head and Registered Office: 1st Floor, Moor House, 120 London Wall, London, EC2Y 5ET. StoneX Financial Ltd is a company registered in England and Wales, number: 05616586. Authorised and regulated by the Financial Conduct Authority. FCA Register Number: 446717.
City Index is a trademark of StoneX Financial Ltd.
The information on this website is not targeted at the general public of any particular country. It is not intended for distribution to residents in any country where such distribution or use would contravene any local law or regulatory requirement.
© City Index 2024