USD CAD A potential bull haven from market turmoil
Depending on your trading style, you either can’t wait to hear the closing bell at the end of today’s US session or you’ll be extremely sorry to see this week come to an end. Either way, there’s still a full trading session today, as well as another two and a half weeks, before the Federal Reserve’s highly-anticipated September monetary policy meeting. Market volatility is likely here to stay until (at least) that event and likely beyond, so it makes sense to see which strong trends managed to weather this week’s jumpy markets.
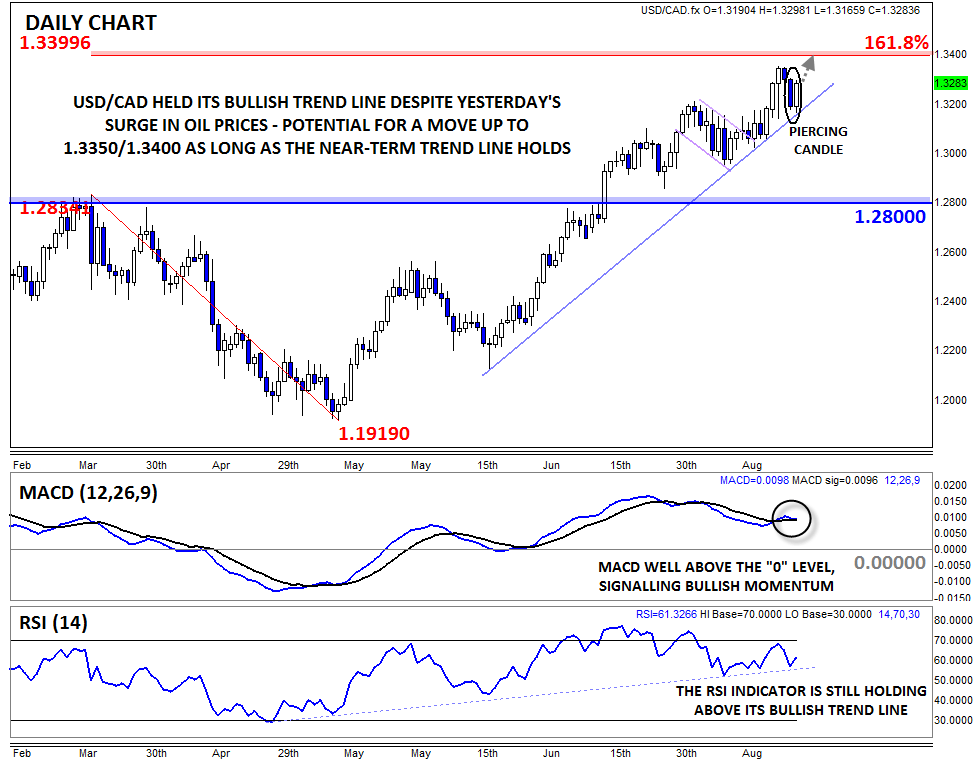
One of the clearest trends in G10 FX right now is in USD/CAD, which continues to find support at the bullish trend line off its mid-June low. The pair’s strength is all the more impressive considering yesterday’s massive rally in oil prices. West Texas Intermediate (WTI) oil rocketed nearly 10% yesterday, the biggest move for so-called “black gold” since 2009. As we’ve noted before, Canada is the world’s sixth largest oil producer and the largest single exporter of oil to the United States, so the commodity’s price (usually) has a clear influence on the Canadian dollar.
While the loonie did strengthen somewhat yesterday, the gains were relatively limited in scope, with USD/CAD “only” edging down by about 125 pips back to its bullish trend line. Now, rates are seeing a strong recovery, creating a potential Piercing Candle* on the daily chart. This candlestick pattern indicates a shift from selling to buying pressure and raises the probability of a near-term low forming. Simultaneously, the secondary indicators are also constructive, with the MACD solidly above the “0” level and the RSI holding its recent bullish trend line.
As it currently stands, the USD/CAD uptrend remains healthy and may provide a haven for traders seeking shelter from ongoing market turmoil. To the topside, the key levels to watch will be this week’s 11-year high at 1.3350, followed by the 161.8% Fibonacci extension of the Q2 pullback at 1.3400. Alternatively, a break below the bullish trend line at 1.3175 would shift the near-term bias back to neutral as traders go looking for another trend.
*A Piercing Candle is formed when a candle trades below the previous candle’s low, but buyers step in and push rates up to close in the upper half of the previous candle’s range. It suggests a potential bullish trend reversal.
StoneX Financial Ltd (trading as “City Index”) is an execution-only service provider. This material, whether or not it states any opinions, is for general information purposes only and it does not take into account your personal circumstances or objectives. This material has been prepared using the thoughts and opinions of the author and these may change. However, City Index does not plan to provide further updates to any material once published and it is not under any obligation to keep this material up to date. This material is short term in nature and may only relate to facts and circumstances existing at a specific time or day. Nothing in this material is (or should be considered to be) financial, investment, legal, tax or other advice and no reliance should be placed on it.
No opinion given in this material constitutes a recommendation by City Index or the author that any particular investment, security, transaction or investment strategy is suitable for any specific person. The material has not been prepared in accordance with legal requirements designed to promote the independence of investment research. Although City Index is not specifically prevented from dealing before providing this material, City Index does not seek to take advantage of the material prior to its dissemination. This material is not intended for distribution to, or use by, any person in any country or jurisdiction where such distribution or use would be contrary to local law or regulation.
For further details see our full non-independent research disclaimer and quarterly summary.
CFDs are complex instruments and come with a high risk of losing money rapidly due to leverage. 69% of retail investor accounts lose money when trading CFDs with this provider. You should consider whether you understand how CFDs work and whether you can afford to take the high risk of losing your money. CFD and Forex Trading are leveraged products and your capital is at risk. They may not be suitable for everyone. Please ensure you fully understand the risks involved by reading our full risk warning.
City Index is a trading name of StoneX Financial Ltd. Head and Registered Office: 1st Floor, Moor House, 120 London Wall, London, EC2Y 5ET. StoneX Financial Ltd is a company registered in England and Wales, number: 05616586. Authorised and regulated by the Financial Conduct Authority. FCA Register Number: 446717.
City Index is a trademark of StoneX Financial Ltd.
The information on this website is not targeted at the general public of any particular country. It is not intended for distribution to residents in any country where such distribution or use would contravene any local law or regulatory requirement.
© City Index 2024