US Treasury bonds may see further downside pressure
Medium-term technical outlook on U.S. Treasury Bonds ETF (TLT)
click to enlarge charts
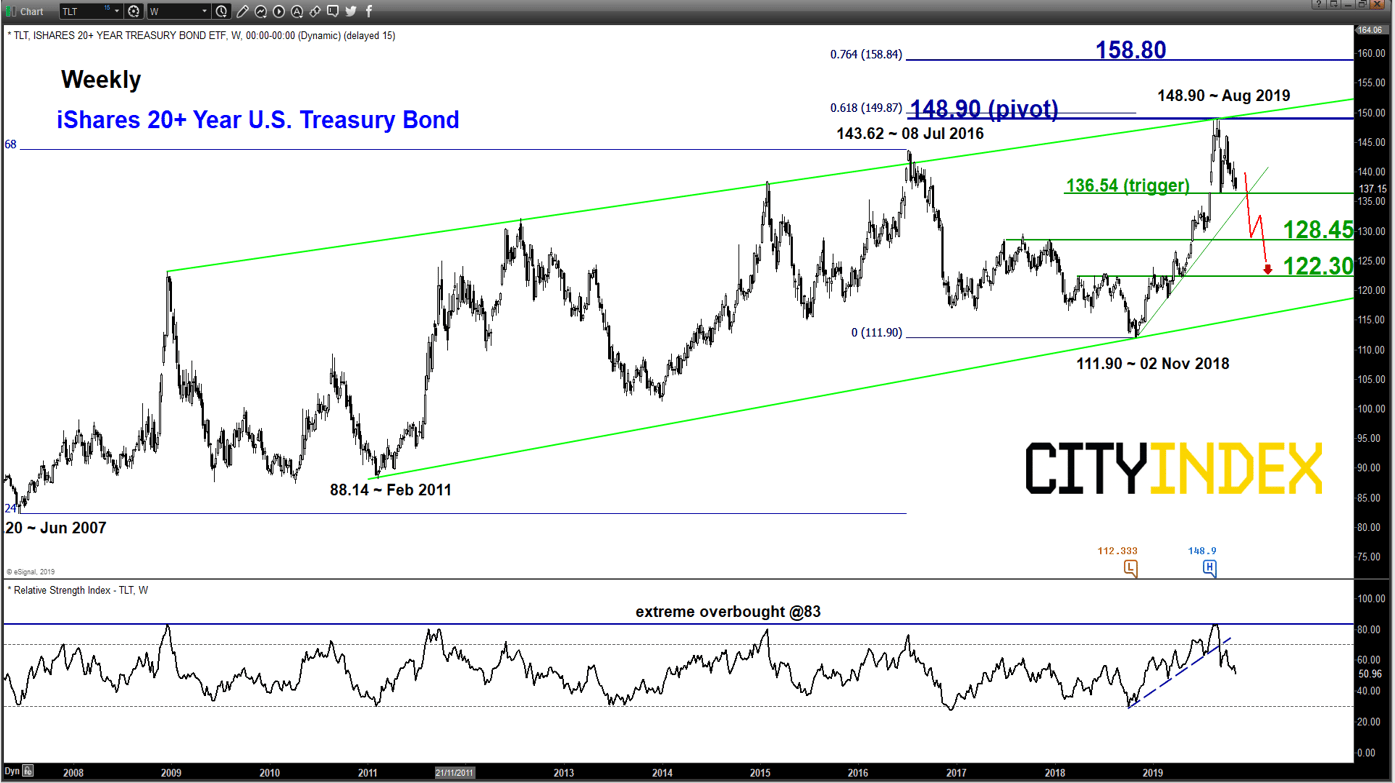
Key Levels (1 to 3 weeks)
Pivot (key resistance): 148.90
Supports: 136.54, 128.45 & 122.30
Next resistance: 158.80
Directional Bias (1 to 3 weeks)
Bearish bias for TLT below 148.90 pivotal resistance and a break below 136.54 is likely to trigger a potential multi-week corrective down move to target the next supports at 128.45 and 122.60 (the lower boundary of a major ascending channel from Feb 2011 low).
On the other hand, a clearance with a daily close above 148.90 see an extension of the up move towards 158.90 next (Fibonacci expansion cluster).
Key elements
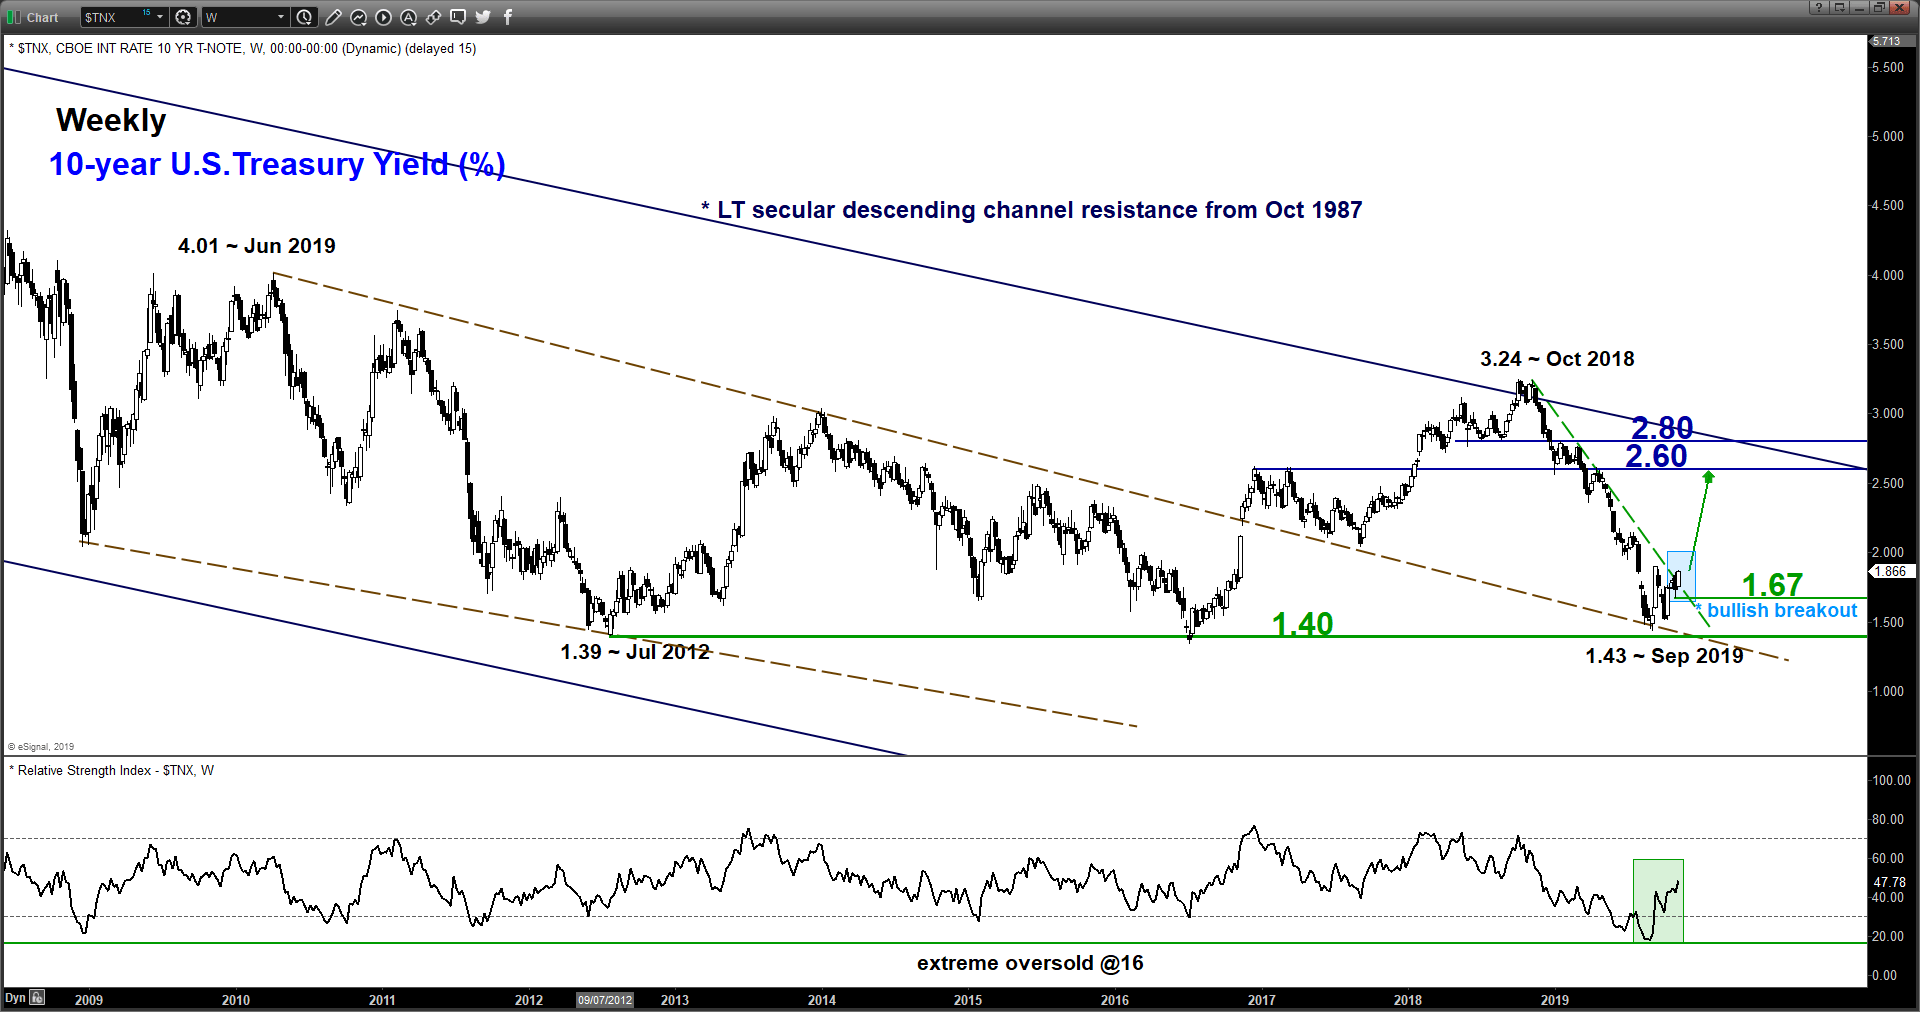
- The U.S. Treasury 10-year yield has started to show signs of resilient after its 11-month of downtrend from Oct 2018 high of 3.24% has managed to stall at a major support at the 1.40% level that has prevented further decline since Jul 2012.
- The recent rebound from Sep 2019 low of 1.43% has broken above a descending trendline from Oct 2018 swing high with the weekly RSI oscillator that has exited from its oversold region. These observations suggest a potential mean reversion rebound towards 2.60%-2.80% zone within a long-term secular descending channel in place since Oct 1987.
- The movement of the Treasury yield has an inverse relationship with the prices of Treasury bonds; if yield goes up it will cause the bond prices to fall and vice versa.
- The 136.54 downside trigger for the U.S. Treasury Bond ETF (TLT) is defined by the ascending support from 02 Nov 2018 low and the Sep 2019 swing low. Interestingly, the weekly RSI oscillator has shaped a bearish breakdown from its corresponding ascending support after it hit an extreme overbought level of 83. These observations suggest a bearish presignal on the price action of TLT which increases the odds of a breakdown below 136.54.
Charts are from eSignal
StoneX Financial Ltd (trading as “City Index”) is an execution-only service provider. This material, whether or not it states any opinions, is for general information purposes only and it does not take into account your personal circumstances or objectives. This material has been prepared using the thoughts and opinions of the author and these may change. However, City Index does not plan to provide further updates to any material once published and it is not under any obligation to keep this material up to date. This material is short term in nature and may only relate to facts and circumstances existing at a specific time or day. Nothing in this material is (or should be considered to be) financial, investment, legal, tax or other advice and no reliance should be placed on it.
No opinion given in this material constitutes a recommendation by City Index or the author that any particular investment, security, transaction or investment strategy is suitable for any specific person. The material has not been prepared in accordance with legal requirements designed to promote the independence of investment research. Although City Index is not specifically prevented from dealing before providing this material, City Index does not seek to take advantage of the material prior to its dissemination. This material is not intended for distribution to, or use by, any person in any country or jurisdiction where such distribution or use would be contrary to local law or regulation.
For further details see our full non-independent research disclaimer and quarterly summary.
CFDs are complex instruments and come with a high risk of losing money rapidly due to leverage. 69% of retail investor accounts lose money when trading CFDs with this provider. You should consider whether you understand how CFDs work and whether you can afford to take the high risk of losing your money. CFD and Forex Trading are leveraged products and your capital is at risk. They may not be suitable for everyone. Please ensure you fully understand the risks involved by reading our full risk warning.
City Index is a trading name of StoneX Financial Ltd. Head and Registered Office: 1st Floor, Moor House, 120 London Wall, London, EC2Y 5ET. StoneX Financial Ltd is a company registered in England and Wales, number: 05616586. Authorised and regulated by the Financial Conduct Authority. FCA Register Number: 446717.
City Index is a trademark of StoneX Financial Ltd.
The information on this website is not targeted at the general public of any particular country. It is not intended for distribution to residents in any country where such distribution or use would contravene any local law or regulatory requirement.
© City Index 2024