US stocks is this the turning point lower
The movements of stock prices in the days prior to the Fed’s rate decision on Thursday appeared to be the typical “buy the rumour, sell the news” sort of behaviour. But when the news hit the wires, traders initially hesitated to push the ‘sell’ button because there was an element of surprise in the FOMC statement that was probably not priced in. Not only did one FOMC member vote to cut rates into the negative, but the dot plot showed that the median policy maker now expects core inflation to remain below the bank’s 2% target until 2018 and the long-term unemployment rate was revised down to 4.9%, suggesting there is less urgency to hike interest rates. So, to account for this surprise, they waited a bit longer before ‘dumping’ stocks.
The markets’ not-so-bullish response to the seemingly dovish message also suggests that investors probably are growing tired of the Fed’s waiting game and can no longer justify buying stocks at these still-elevated levels due to minor changes in the outlook for interest rates. What the markets really need right now is for economic growth to really pick up momentum and not only in the US but also in China, Europe and elsewhere. As there is little or no sign of this happening, I am still of the view that the markets may have peaked and that we are in the process of a slow grind lower for at least a good few months. That being said though, a sustained move lower for the dollar as a result of a dovish Fed or otherwise should be good news for US exports and therefore earnings, while commodity stocks could start to outperform as the buck-denominated gold and oil prices recover their poise. In the case of oil, the expected fall of US output should in theory help to support prices, even if major upward moves seem unlikely for the foreseeable future.
Technical outlook: Nasdaq 100
Following the breakdown of long-term bullish trends in August on the major indices, and the corresponding sell-off, the markets have bounced back as the sellers took profit and opportunistic bulls did some bargain hunting. But now that we’ve had a decent pullback, is it time for stocks to head lower once more?
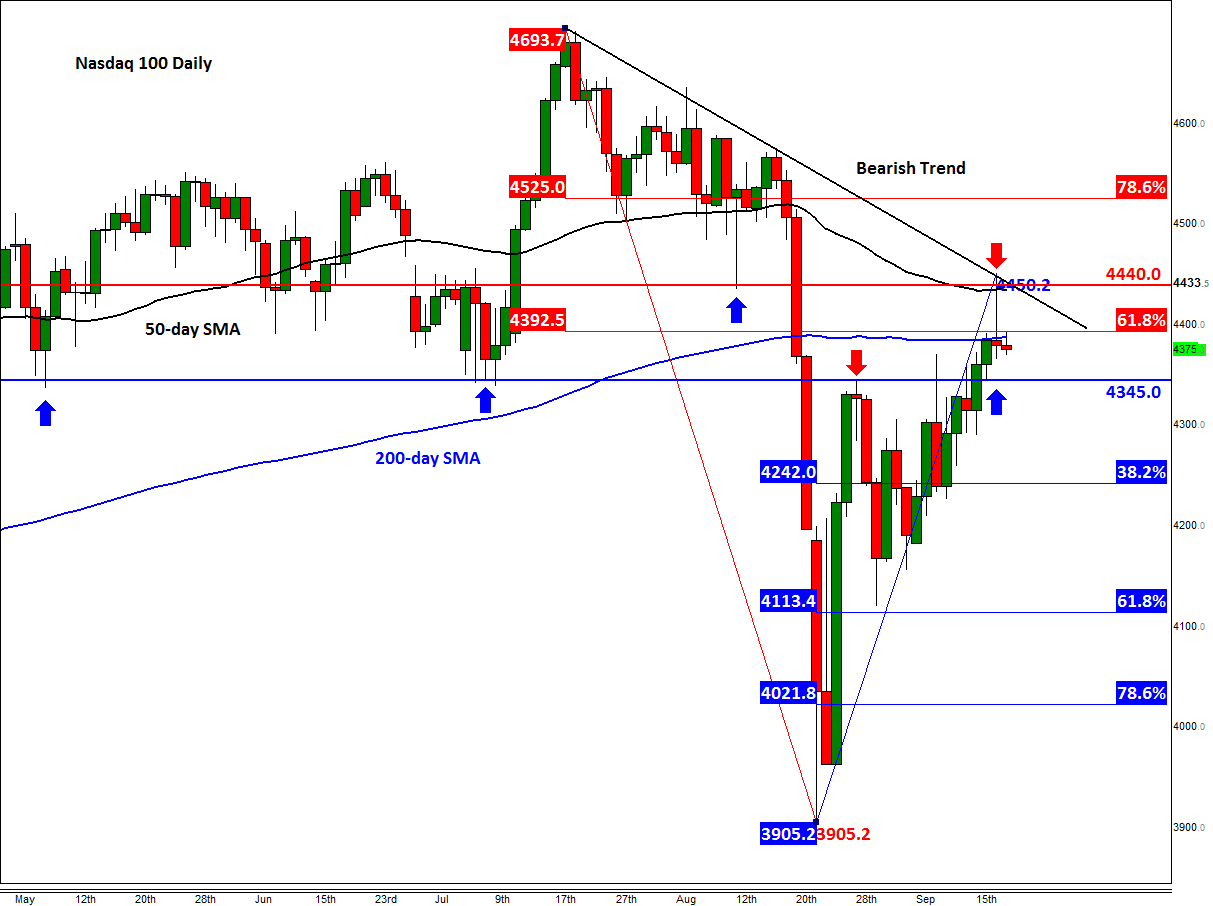
Among the major US indices, the Nasdaq 100 looks the most technically-friendly – in fact, almost textbook perfect. If it was to resume its downward trend, it would do so from around these levels. As can be seen from the daily chart, the index ran into a wall of resistance around 4440 following an initial rally on the back of the FOMC decision on Thursday. Here, a bearish trend line, the 50-day moving average and previous support all acted as stiff resistance, leading to a sharp re-treat. The U-turn helped to create a doji-like candle on the daily chart, which points to indecision and a potential sell-off from around these-technically important levels. What’s more, the body of Thursday’s candle held below the 200-day moving average: another bearish outcome.
Should the index retreat now as the chart suggests, the potential support level that will then need to be taken out is around 4345, which was formerly resistance. Below here, there are not much further short-term supports seen until the 38.2% Fibonacci retracement level at 4242. But the potential sell-off could go a lot further and who knows may even revisit and indeed break last month’s lows.
This bearish setup would become invalid however on a potential rally and closing break above the trend line. If seen, the Nasdaq may then stage a rally to at least the 78.6% Fibonacci level at 4525, before heading towards the prior high of 4694 next.
StoneX Financial Ltd (trading as “City Index”) is an execution-only service provider. This material, whether or not it states any opinions, is for general information purposes only and it does not take into account your personal circumstances or objectives. This material has been prepared using the thoughts and opinions of the author and these may change. However, City Index does not plan to provide further updates to any material once published and it is not under any obligation to keep this material up to date. This material is short term in nature and may only relate to facts and circumstances existing at a specific time or day. Nothing in this material is (or should be considered to be) financial, investment, legal, tax or other advice and no reliance should be placed on it.
No opinion given in this material constitutes a recommendation by City Index or the author that any particular investment, security, transaction or investment strategy is suitable for any specific person. The material has not been prepared in accordance with legal requirements designed to promote the independence of investment research. Although City Index is not specifically prevented from dealing before providing this material, City Index does not seek to take advantage of the material prior to its dissemination. This material is not intended for distribution to, or use by, any person in any country or jurisdiction where such distribution or use would be contrary to local law or regulation.
For further details see our full non-independent research disclaimer and quarterly summary.
CFDs are complex instruments and come with a high risk of losing money rapidly due to leverage. 69% of retail investor accounts lose money when trading CFDs with this provider. You should consider whether you understand how CFDs work and whether you can afford to take the high risk of losing your money. CFD and Forex Trading are leveraged products and your capital is at risk. They may not be suitable for everyone. Please ensure you fully understand the risks involved by reading our full risk warning.
City Index is a trading name of StoneX Financial Ltd. Head and Registered Office: 1st Floor, Moor House, 120 London Wall, London, EC2Y 5ET. StoneX Financial Ltd is a company registered in England and Wales, number: 05616586. Authorised and regulated by the Financial Conduct Authority. FCA Register Number: 446717.
City Index is a trademark of StoneX Financial Ltd.
The information on this website is not targeted at the general public of any particular country. It is not intended for distribution to residents in any country where such distribution or use would contravene any local law or regulatory requirement.
© City Index 2024