US Stock Selection FedEx facing further downside pressure ahead of earnings release
FedEx (FDX)
click to enlarge charts
FedEx will announce its Q4 fiscal year earnings ended May 2019 later today, 25 Jun after the close of the U.S. session. Based on data from Refinitiv, analysts have estimated its earnings per share (EPS) to come in at 4.85 which is 18% below the similar quarter a year ago. Below are some key fundamental quick facts before we dive into the technical analysis of FedEx:
- In the previous Q3 fiscal year earnings ended Feb 2019, its actual EPS came in at 3.03 which as below expectations by -2.67% against a mean estimate of 3.11.
- Earnings have been projected lower due to headwinds from slower global economic that will impact its transportation business due to on-going trade tensions between U.S. and China.
Key technical elements
- In yesterday’s 24 Jun U.S. session, the share price of FDX has staged a breakdown from the minor “bearish flag” ascending range configuration in place since 03 Jun 2019 low of 150.68 now turns pull-back resistance at 165.13
- The breakdown from the minor ‘bearish flag” has been accompanied by an increased in volume versus its 10-day average volume since 03Jun 2019 low.
- Medium-term price momentum remains negative as indicated by the daily RSI oscillator.
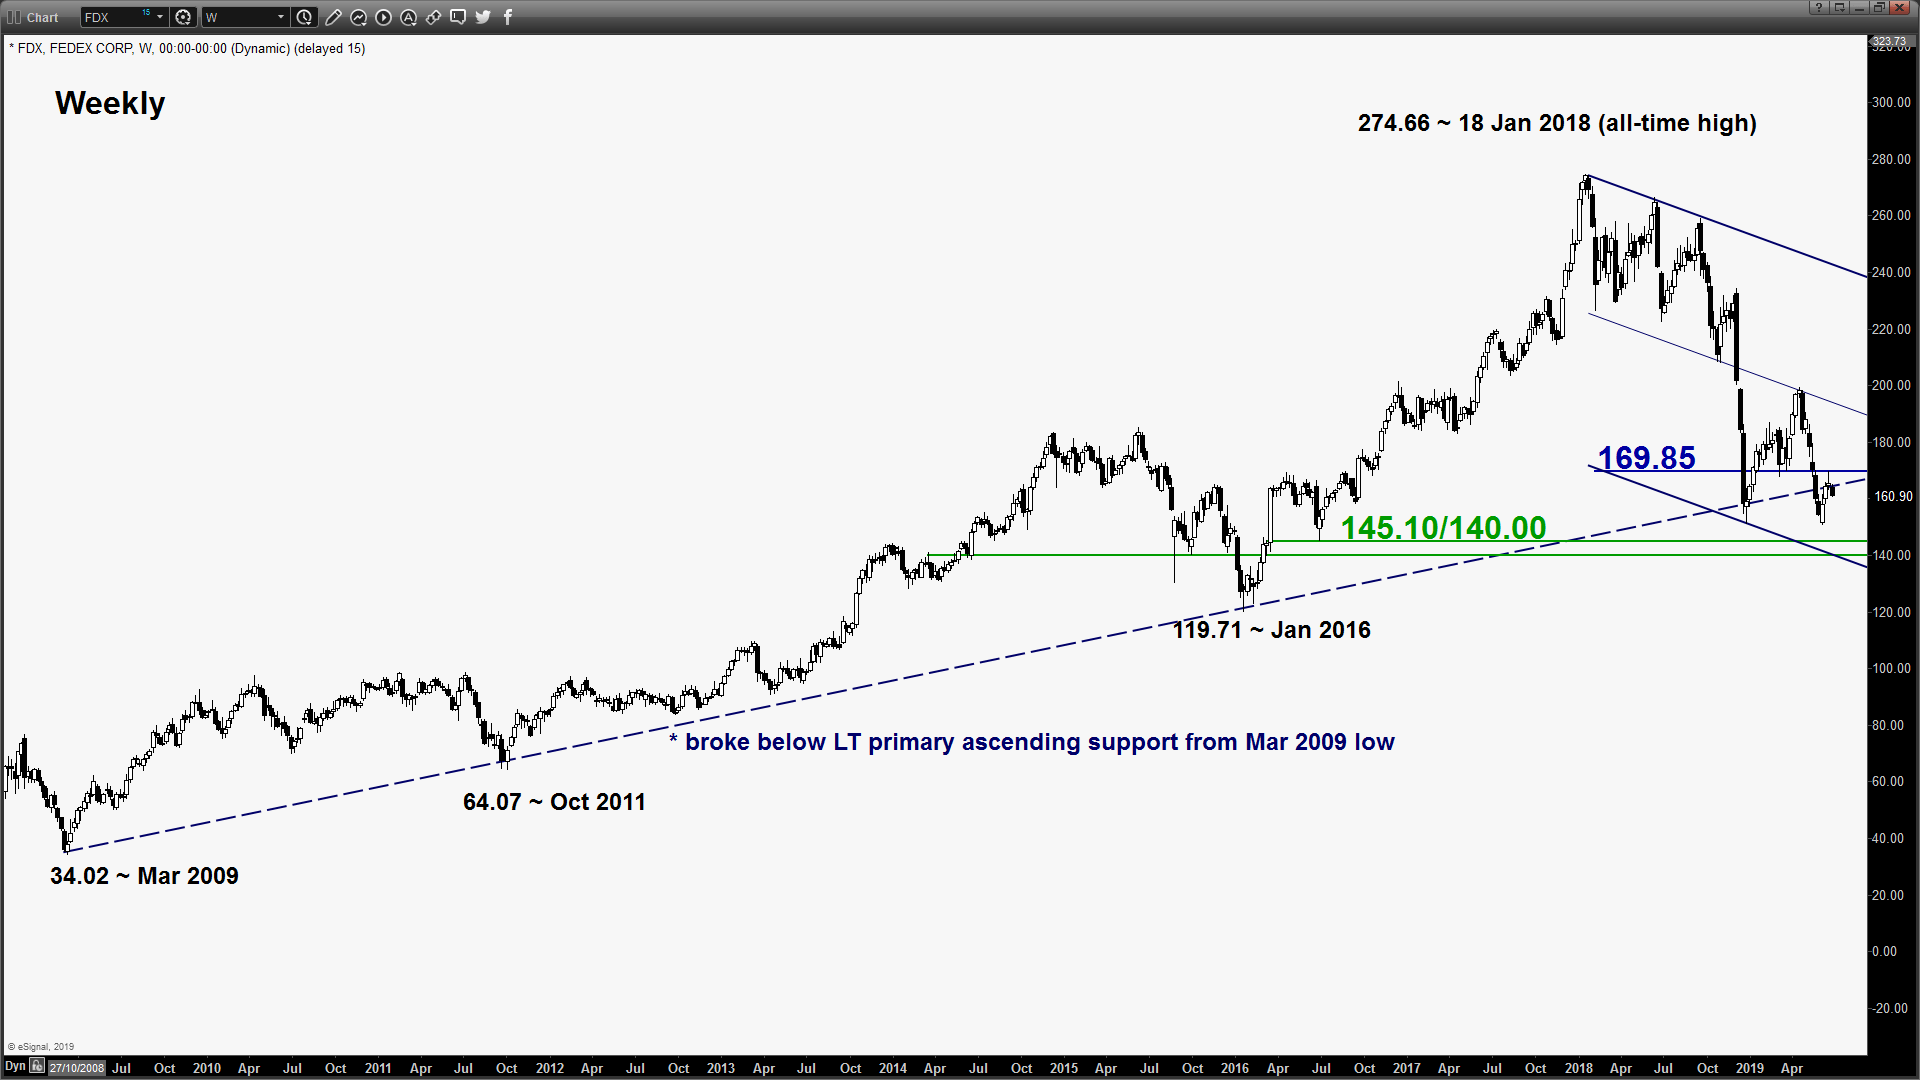
- The key medium-term resistance stands at 169.85 which is also the pull-back resistance of the former long-term primary ascending support from Mar 2009 low.
- Relative strength analysis from the ratios of FDX against its industry sector (S&P Industrials XLI) and the U.S. benchmark stock index (S&P 500) have continued to exhibit medium-term weakness/underperformance.
Key Levels (1 to 3 weeks)
Intermediate resistance: 165.13
Pivot (key resistance): 169.85
Support: 145.10/140.00
Next resistance: 190.65/198.00
Conclusion
If the 165.13 key medium-term pivotal resistance is not surpassed, FDX is likely to see the start of another impulsive downleg sequence to target the next significant medium-term support zone at 145.10/140.00 (also a Fibonacci expansion cluster).
However, a clearance with a daily close above 169.85 invalidates the bearish scenario to kick start a corrective rebound sequence towards the next resistance at 190.65/198.00 (also the median line of the major descending channel in place since 18 Jan 2018).
Charts are from eSignal
StoneX Financial Ltd (trading as “City Index”) is an execution-only service provider. This material, whether or not it states any opinions, is for general information purposes only and it does not take into account your personal circumstances or objectives. This material has been prepared using the thoughts and opinions of the author and these may change. However, City Index does not plan to provide further updates to any material once published and it is not under any obligation to keep this material up to date. This material is short term in nature and may only relate to facts and circumstances existing at a specific time or day. Nothing in this material is (or should be considered to be) financial, investment, legal, tax or other advice and no reliance should be placed on it.
No opinion given in this material constitutes a recommendation by City Index or the author that any particular investment, security, transaction or investment strategy is suitable for any specific person. The material has not been prepared in accordance with legal requirements designed to promote the independence of investment research. Although City Index is not specifically prevented from dealing before providing this material, City Index does not seek to take advantage of the material prior to its dissemination. This material is not intended for distribution to, or use by, any person in any country or jurisdiction where such distribution or use would be contrary to local law or regulation.
For further details see our full non-independent research disclaimer and quarterly summary.
CFDs are complex instruments and come with a high risk of losing money rapidly due to leverage. 69% of retail investor accounts lose money when trading CFDs with this provider. You should consider whether you understand how CFDs work and whether you can afford to take the high risk of losing your money. CFD and Forex Trading are leveraged products and your capital is at risk. They may not be suitable for everyone. Please ensure you fully understand the risks involved by reading our full risk warning.
City Index is a trading name of StoneX Financial Ltd. Head and Registered Office: 1st Floor, Moor House, 120 London Wall, London, EC2Y 5ET. StoneX Financial Ltd is a company registered in England and Wales, number: 05616586. Authorised and regulated by the Financial Conduct Authority. FCA Register Number: 446717.
City Index is a trademark of StoneX Financial Ltd.
The information on this website is not targeted at the general public of any particular country. It is not intended for distribution to residents in any country where such distribution or use would contravene any local law or regulatory requirement.
© City Index 2024