US investors look for a floor nearby
The S&P 500 is now on course for its longest losing streak since 2008, in the wake of news late last week that the FBI was reopening its ‘emailgate’ enquiry, tipping the US election race into uncertainty.
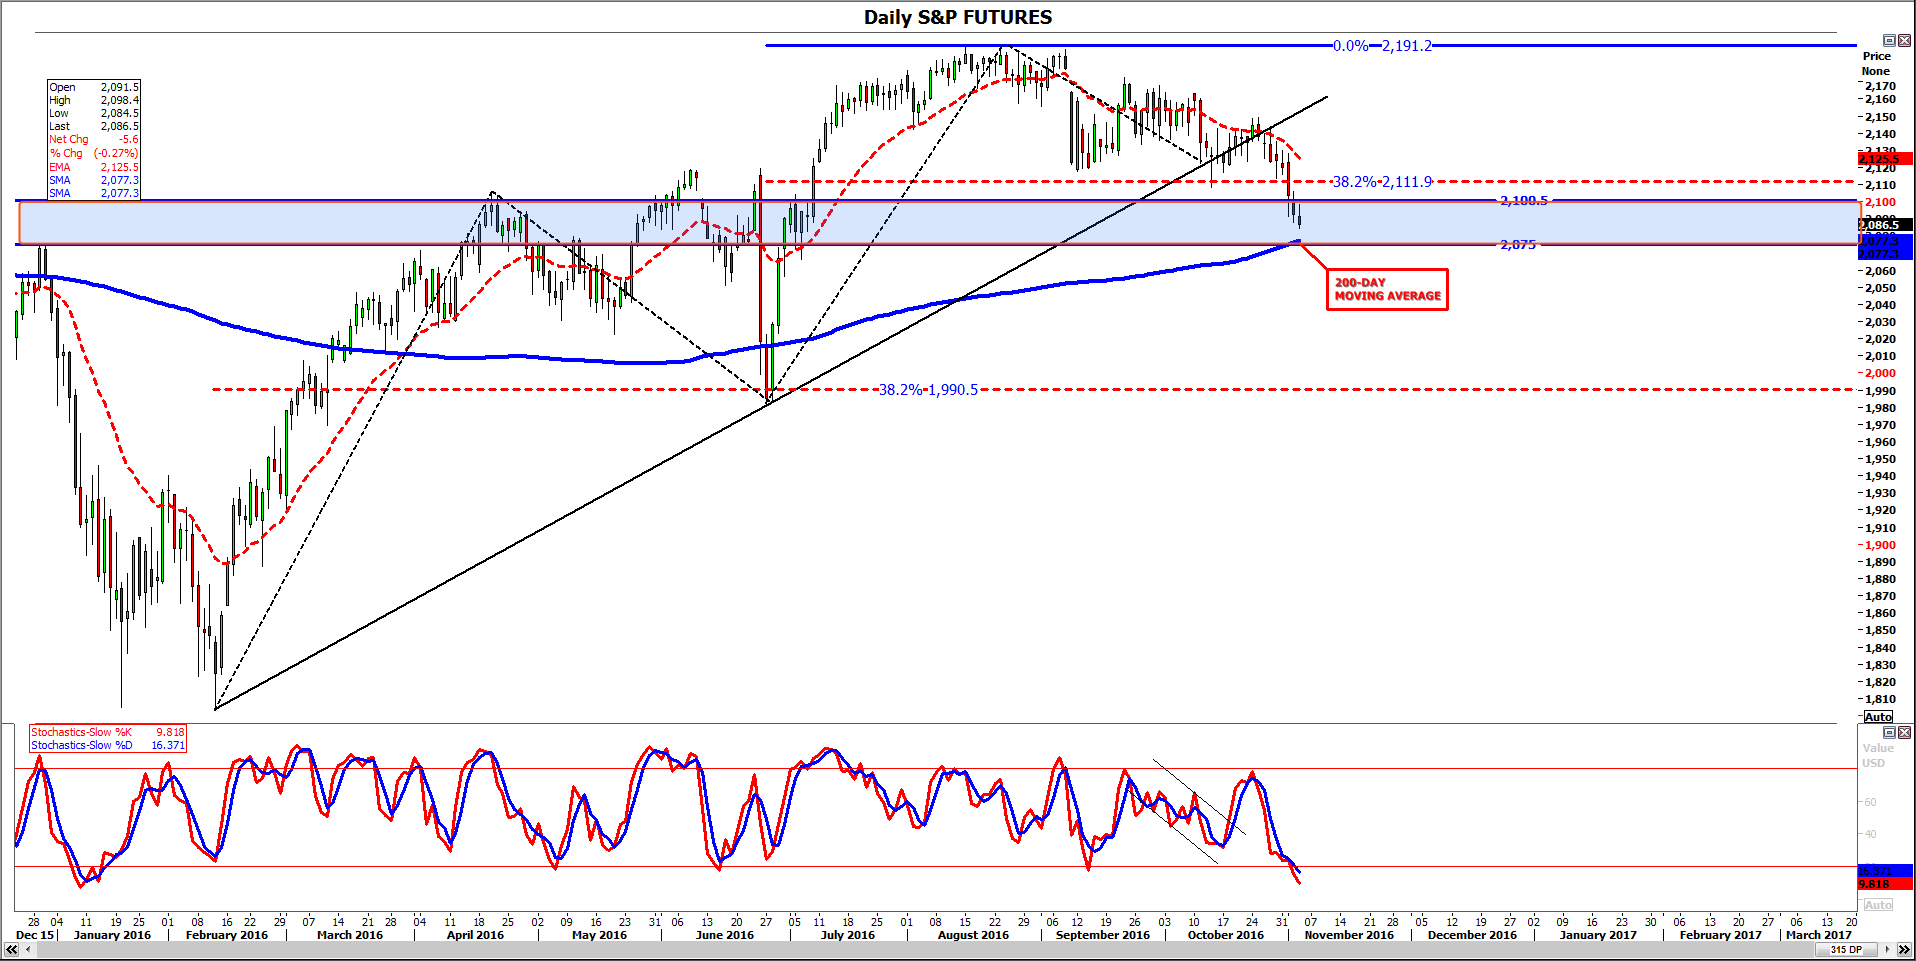
Hopes that the index would bounce at a closely watched support comprised of a 38.2% retracement of its most recent strong up-leg have proved to be forlorn.
In fact, looking at the chart for one of the most liquid, tradeable derivatives of the benchmark, its futures contract, the market has overshot and is now eyeing the next likely support zone (formerly resistance) 2075-2100, where its last rising phase kicked off in June.
The VIX is exacerbating the picture.
Typically passive, the ‘fear gauge’ sprang back into life this week after prospects of the Democratic candidate Hillary Clinton—widely perceived to be more ‘market friendly’—appeared to take a step back, as her lead in most polls narrowed amid renewed FBI scrutiny.
The VIX tagged the 20 level again on Thursday. It was the second touch in days of a mark U.S. investors commonly see as the threshold of widespread risk aversion.
A look at the the U.S. stock market’s advance/decline ratio showed the bearish tendency was broad-based, with a ratio of as much as 1:5 in favour of fallers, according to a snapshot of New York Stock Exchange data taken earlier this week.
From a technical chart perspective, what looks to be a looming test of the S&P 500 future’s 200-day moving average could be a key juncture.
The line, currently around 2077 (blue in the chart below), has been gently pointing higher since June, and continues to do so, suggesting buying momentum may require longer to exhaust, regardless of the deepening reversal.
However, should both the aforementioned support zone and moving average fail to support the market, a sharper fall—perhaps to this summer’s 1981 low—could be on the cards.
DAILY CHART: S&P 500 FUTURES (CONTINUATION)
Please click image to enlarge
StoneX Financial Ltd (trading as “City Index”) is an execution-only service provider. This material, whether or not it states any opinions, is for general information purposes only and it does not take into account your personal circumstances or objectives. This material has been prepared using the thoughts and opinions of the author and these may change. However, City Index does not plan to provide further updates to any material once published and it is not under any obligation to keep this material up to date. This material is short term in nature and may only relate to facts and circumstances existing at a specific time or day. Nothing in this material is (or should be considered to be) financial, investment, legal, tax or other advice and no reliance should be placed on it.
No opinion given in this material constitutes a recommendation by City Index or the author that any particular investment, security, transaction or investment strategy is suitable for any specific person. The material has not been prepared in accordance with legal requirements designed to promote the independence of investment research. Although City Index is not specifically prevented from dealing before providing this material, City Index does not seek to take advantage of the material prior to its dissemination. This material is not intended for distribution to, or use by, any person in any country or jurisdiction where such distribution or use would be contrary to local law or regulation.
For further details see our full non-independent research disclaimer and quarterly summary.
CFDs are complex instruments and come with a high risk of losing money rapidly due to leverage. 69% of retail investor accounts lose money when trading CFDs with this provider. You should consider whether you understand how CFDs work and whether you can afford to take the high risk of losing your money. CFD and Forex Trading are leveraged products and your capital is at risk. They may not be suitable for everyone. Please ensure you fully understand the risks involved by reading our full risk warning.
City Index is a trading name of StoneX Financial Ltd. Head and Registered Office: 1st Floor, Moor House, 120 London Wall, London, EC2Y 5ET. StoneX Financial Ltd is a company registered in England and Wales, number: 05616586. Authorised and regulated by the Financial Conduct Authority. FCA Register Number: 446717.
City Index is a trademark of StoneX Financial Ltd.
The information on this website is not targeted at the general public of any particular country. It is not intended for distribution to residents in any country where such distribution or use would contravene any local law or regulatory requirement.
© City Index 2024