US defense stocks set to benefit from Middle East geopolitical tensions LMT LHX
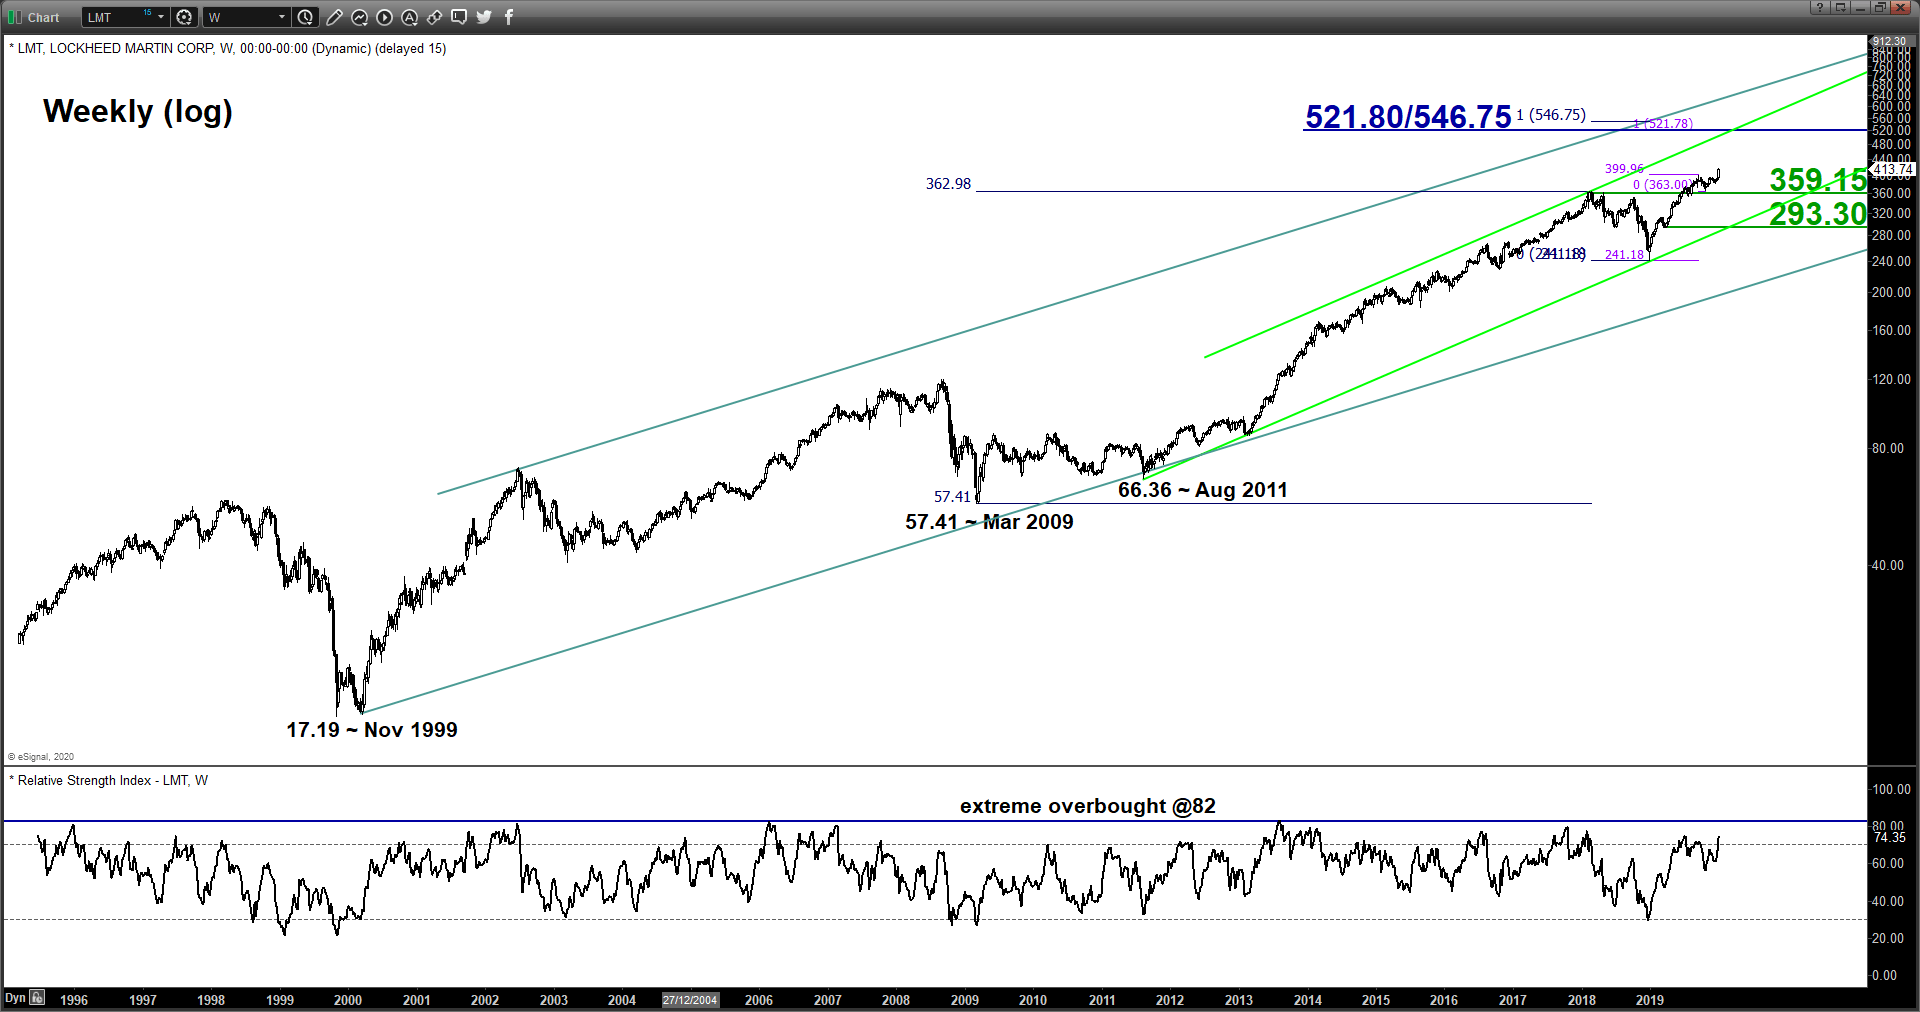
Lockheed Martin Corp (LMT) – Fresh all-time high, further potential upside ahead
click to enlarge charts
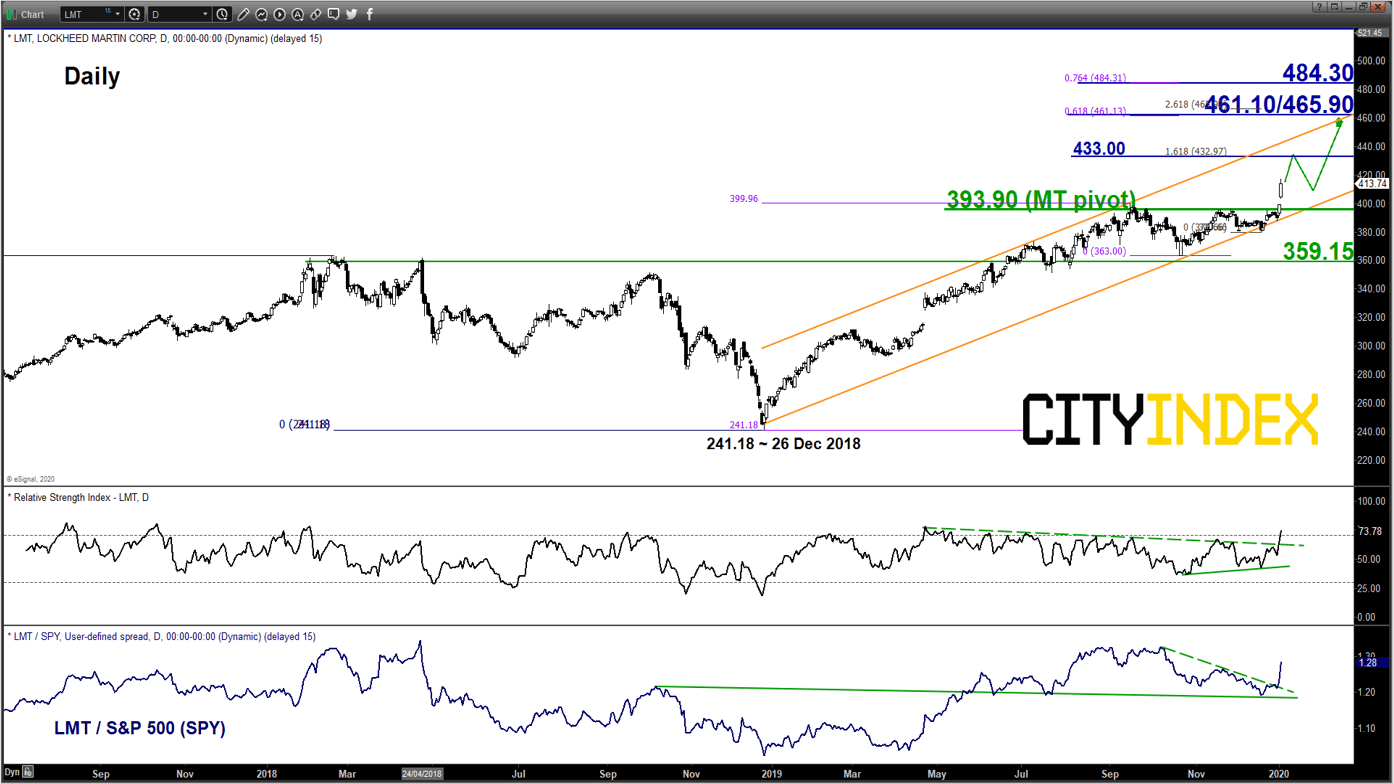
- LMT has staged a bullish breakout on last Fri, 03 Jan 2019 from a 3-month range configuration in place since 17 Sep 2019. Medium-term upside momentum remains intact as seen by the weekly & daily RSI oscillators.
- Relative strength analysis from its ratio (LMT/SPY) suggest outperformance of LMT against the S&P 500.
- Bullish bias in any dips above 393.90 for a further potential push up to target the next resistances at 461.10/465.90 and 484.30. On the other hand, a break with a daily close below 393.90 invalidates the bullish breakout for a choppy slide towards the next support at 359.15 (former swing high areas of 02 Feb/24 Apr 2018).
click to enlarge chart
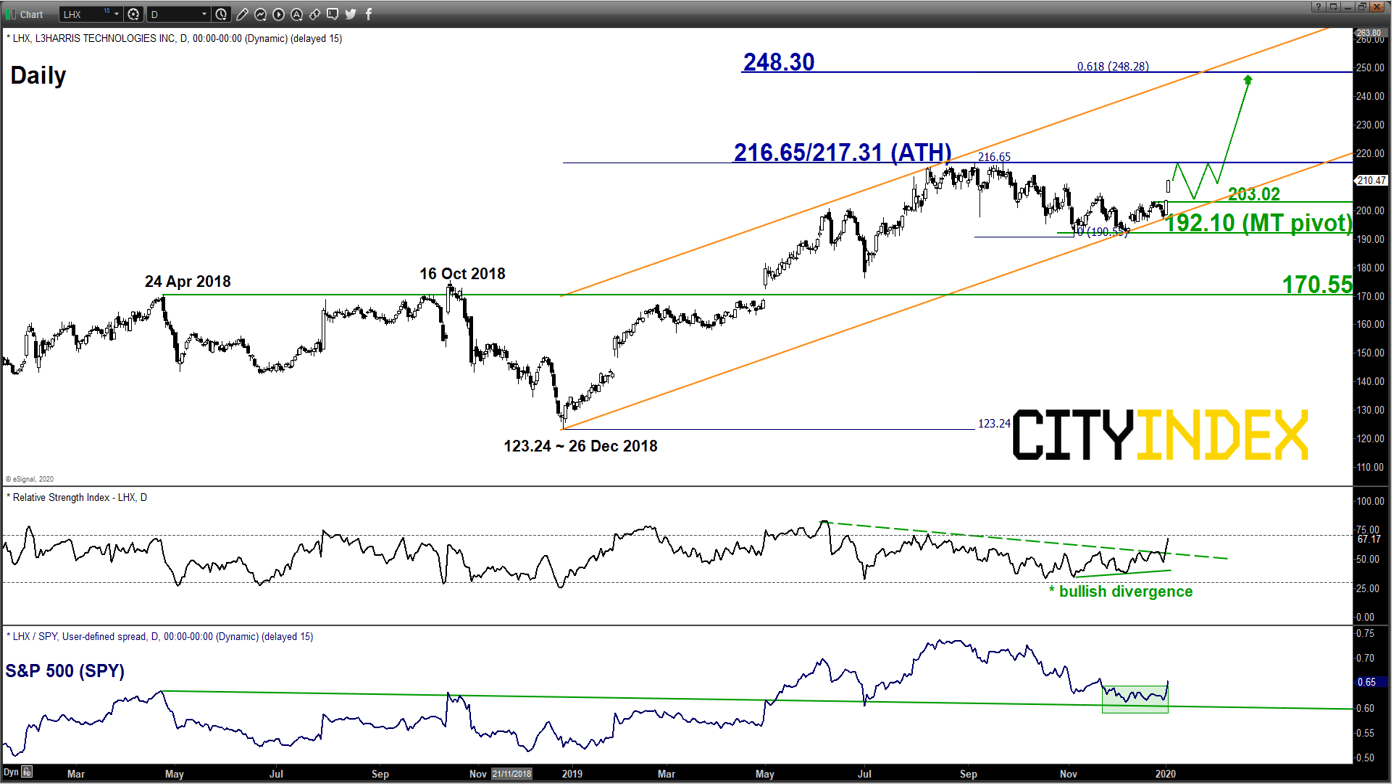
- Last Fri, 03 Jan 2019, the share price of LHX has staged a gapped up above the intermediate swing highs areas of 23/24 Dec 2018 and rallied by 3.70%.
- Elements are bullish with its price action that has continued to evolve within a major ascending channel in place since 26 Dec 2018. The upper boundary of the ascending channel stands at 248.30 which also confluences with the 0.618 Fibonacci expansion of the up move from 26 Dec 2018 low to 06 Sep 2019 high projected from 05 Nov 2019 low.
- Medium-term upside momentum of price action has resurfaced as indicated by the bullish breakout seen in the daily RSI oscillator from a corresponding significant descending resistance after a prior bullish divergence signal.
- Relative strength analysis from its ratio (LHX / SPY) has indicated that LHX has started to show outperformance against the S&P 500.
- Bullish bias in any dips above 192.10 medium-term pivotal support for a further potential push up to retest 217.31 current all-time high before targeting the next resistance at 248.30. On the other hand, a break with a daily close below 192.10 negates the bullish tone for a slide towards the next support at 170.55 (former swing range resistance from 24 Apr/16 Oct 2018).
Charts are from eSignal
StoneX Financial Ltd (trading as “City Index”) is an execution-only service provider. This material, whether or not it states any opinions, is for general information purposes only and it does not take into account your personal circumstances or objectives. This material has been prepared using the thoughts and opinions of the author and these may change. However, City Index does not plan to provide further updates to any material once published and it is not under any obligation to keep this material up to date. This material is short term in nature and may only relate to facts and circumstances existing at a specific time or day. Nothing in this material is (or should be considered to be) financial, investment, legal, tax or other advice and no reliance should be placed on it.
No opinion given in this material constitutes a recommendation by City Index or the author that any particular investment, security, transaction or investment strategy is suitable for any specific person. The material has not been prepared in accordance with legal requirements designed to promote the independence of investment research. Although City Index is not specifically prevented from dealing before providing this material, City Index does not seek to take advantage of the material prior to its dissemination. This material is not intended for distribution to, or use by, any person in any country or jurisdiction where such distribution or use would be contrary to local law or regulation.
For further details see our full non-independent research disclaimer and quarterly summary.
CFDs are complex instruments and come with a high risk of losing money rapidly due to leverage. 69% of retail investor accounts lose money when trading CFDs with this provider. You should consider whether you understand how CFDs work and whether you can afford to take the high risk of losing your money. CFD and Forex Trading are leveraged products and your capital is at risk. They may not be suitable for everyone. Please ensure you fully understand the risks involved by reading our full risk warning.
City Index is a trading name of StoneX Financial Ltd. Head and Registered Office: 1st Floor, Moor House, 120 London Wall, London, EC2Y 5ET. StoneX Financial Ltd is a company registered in England and Wales, number: 05616586. Authorised and regulated by the Financial Conduct Authority. FCA Register Number: 446717.
City Index is a trademark of StoneX Financial Ltd.
The information on this website is not targeted at the general public of any particular country. It is not intended for distribution to residents in any country where such distribution or use would contravene any local law or regulatory requirement.
© City Index 2024