UPDATE Start of new impulsive up move in SP 500 within a potential blow off phase
Medium-term technical outlook on S&P 500
click to enlarge charts
Key technical elements
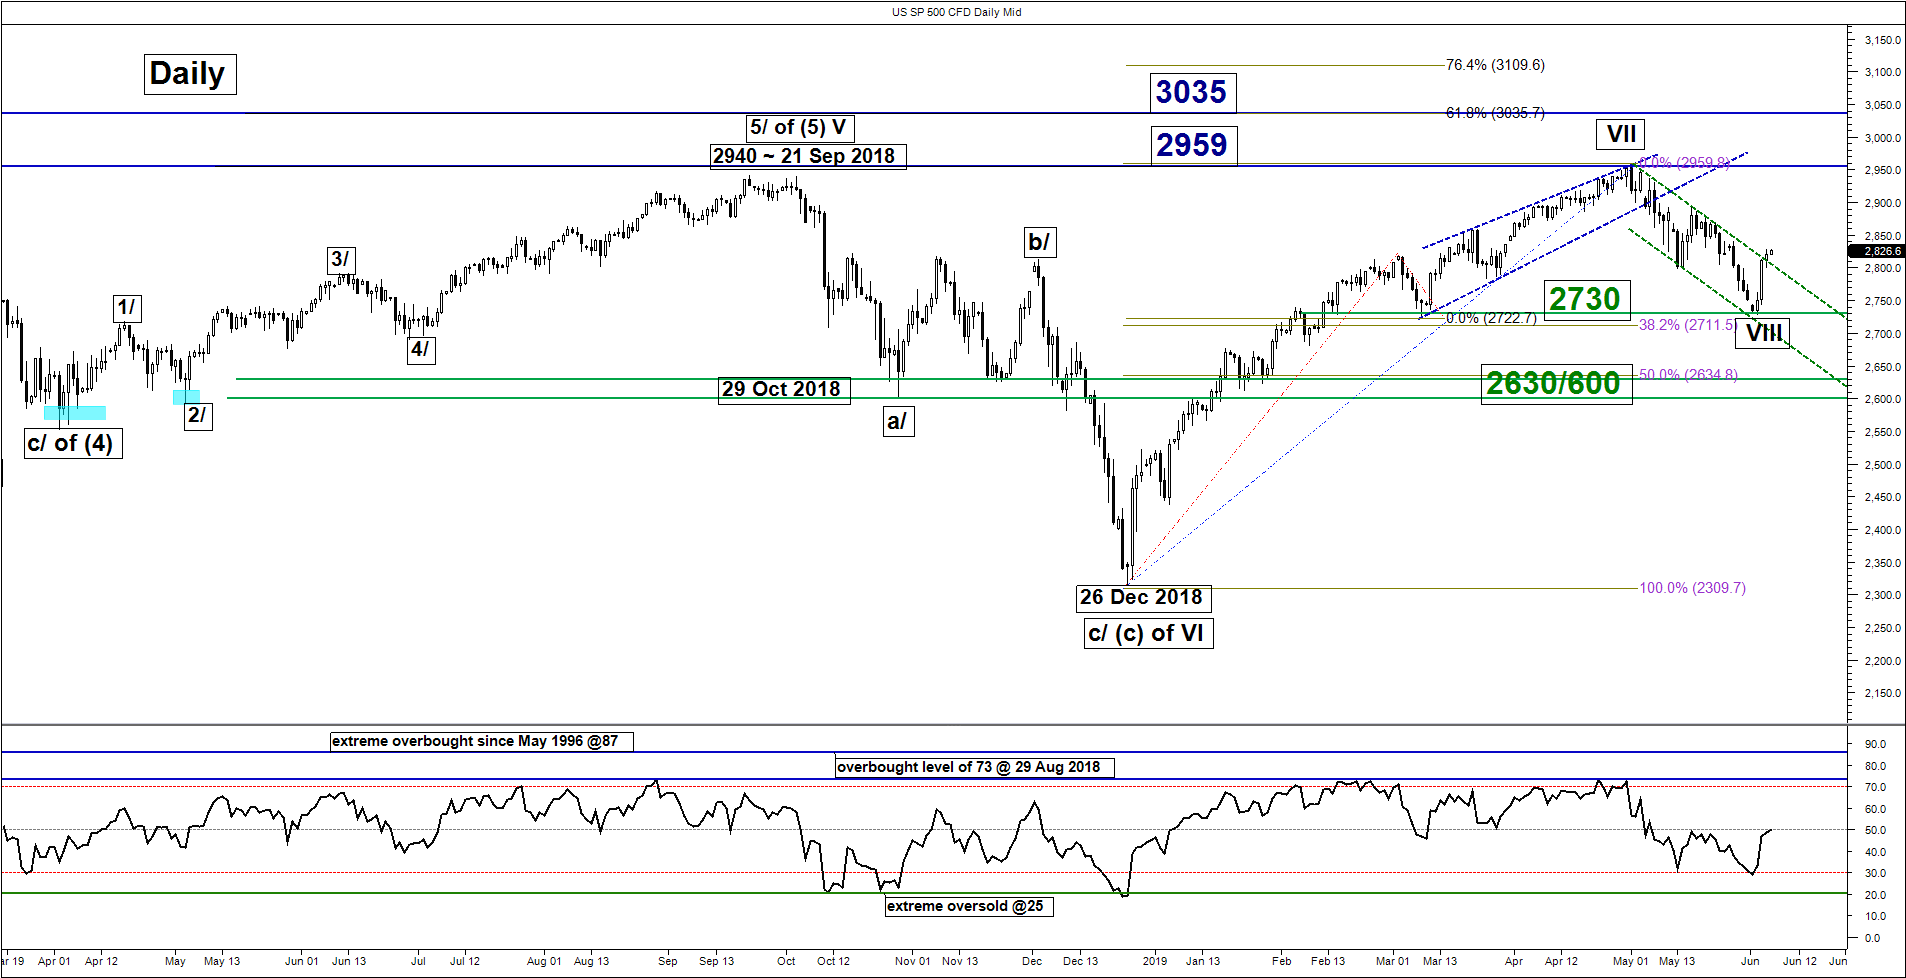
- SP 500 Index (proxy for the S&P 500 futures) has staged a bullish breakout from its former medium-term descending channel in place since its current all-time high level of 2959 printed on 01 May 2019 now turns pull-back support at 2800.
- Medium-term momentum has turned positive with the daily RSI oscillator that has reversed up from its oversold region.
- The bullish reversal low of 2728 printed on this Mon, 03 Jun coincides with the 1.00 Fibonacci projection of the decline from 01 May high to 13 May 2019 low projected from 16 May 2019 high and the 08 Mar 2019 swing low area. Elliot Wave/fractal analysis suggests the start of another potential impulsive up move sequence that may see another fresh all-time high.
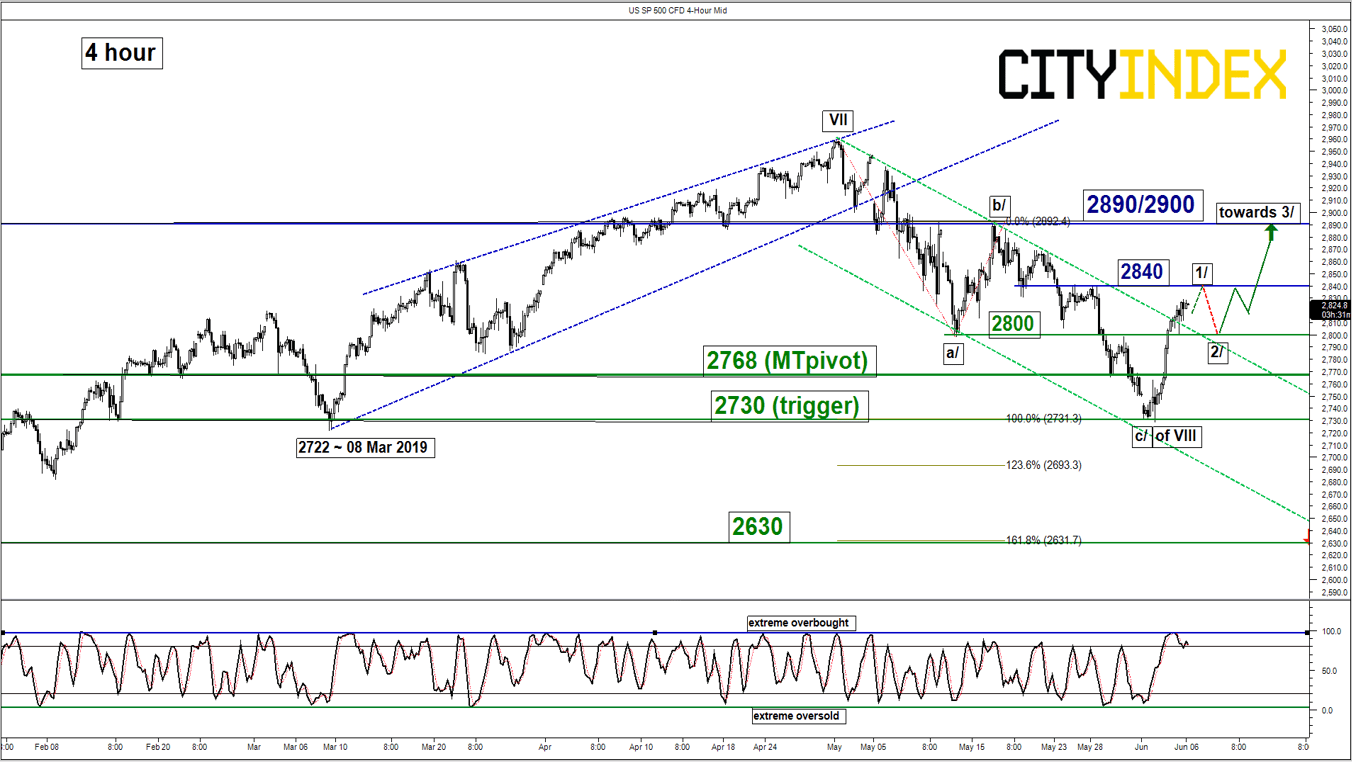
- The key medium-term support rests at 2768 which is defined as the 61.8% Fibonacci retracement of the on-going V-shaped rally from 03 Jun 2019 low.
- Medium-term resistance stands at the 2890/2900 zone which is defined by the swing high areas of 11/17 May 2019 and close to the 76.4% Fibonacci retracement of the previous decline from 01 May high to 03 Jun 2019 low.
- The 4-hour Stochastic oscillator has reached an extreme overbought level at 97 which highlights the risk of an imminent minor pull-back at the intermediate resistance of 2840.
Key Levels (1 to 3 weeks)
Intermediate support: 2800
Pivot (key support): 2768
Resistances: 2840 & 2890/2900
Next supports: 2730 & 2630
Conclusion
The preferred medium-term (1 to 3 weeks) bearish scenario for an extended corrective down move has been invalidated (click here for a recap). Right now, the Index is likely to be shaping an impulsive up move within a long-term cycle degree wave IX that may lead to a potential “blow-off” top. The narrative of the on-going bullish sentiment is led by a “group think” that the U.S. central bank, Fed will be a “liquidity provider of last resort” to cut interest rates or establish another round of QE to support risk assets from falling further in the backdrop of macro environment uncertainties (trade tensions on top of a brewing cold war between U.S. & China).
Similar narrative in a different time and environment before a major top occurs; in 1999 where dot.com and technological stocks were trading at high valuation levels and the justification was the start of a new technology wave that had driven up productivity to support such high valuations. In 2006-07, where the housing boom had been justified by demographics changes and the increased usage of securitization to reduce default risk in housing mortgages.
Watch the key medium-term pivotal support at 2768 that should hold any movement of minor pull-back before another potential up move materialises to target the next resistance at 2890/2900 in the first step.
However, failure to hold 2768 negates the bullish tone for a retest on the 03 Jun 2019 swing low area of 2730 and only a daily close below 2730 revives the corrective down move scenario towards the next support at 2630 (also the 50% Fibonacci retracement of the last up move from 26 Dec 2018 low to 01 May 2019 high).
Charts are from City Index Advantage TraderPro
StoneX Financial Ltd (trading as “City Index”) is an execution-only service provider. This material, whether or not it states any opinions, is for general information purposes only and it does not take into account your personal circumstances or objectives. This material has been prepared using the thoughts and opinions of the author and these may change. However, City Index does not plan to provide further updates to any material once published and it is not under any obligation to keep this material up to date. This material is short term in nature and may only relate to facts and circumstances existing at a specific time or day. Nothing in this material is (or should be considered to be) financial, investment, legal, tax or other advice and no reliance should be placed on it.
No opinion given in this material constitutes a recommendation by City Index or the author that any particular investment, security, transaction or investment strategy is suitable for any specific person. The material has not been prepared in accordance with legal requirements designed to promote the independence of investment research. Although City Index is not specifically prevented from dealing before providing this material, City Index does not seek to take advantage of the material prior to its dissemination. This material is not intended for distribution to, or use by, any person in any country or jurisdiction where such distribution or use would be contrary to local law or regulation.
For further details see our full non-independent research disclaimer and quarterly summary.
CFDs are complex instruments and come with a high risk of losing money rapidly due to leverage. 69% of retail investor accounts lose money when trading CFDs with this provider. You should consider whether you understand how CFDs work and whether you can afford to take the high risk of losing your money. CFD and Forex Trading are leveraged products and your capital is at risk. They may not be suitable for everyone. Please ensure you fully understand the risks involved by reading our full risk warning.
City Index is a trading name of StoneX Financial Ltd. Head and Registered Office: 1st Floor, Moor House, 120 London Wall, London, EC2Y 5ET. StoneX Financial Ltd is a company registered in England and Wales, number: 05616586. Authorised and regulated by the Financial Conduct Authority. FCA Register Number: 446717.
City Index is a trademark of StoneX Financial Ltd.
The information on this website is not targeted at the general public of any particular country. It is not intended for distribution to residents in any country where such distribution or use would contravene any local law or regulatory requirement.
© City Index 2024