Time for multi week mean reversion decline in Nasdaq 100
Medium-term technical outlook on Nasdaq 100 (US Tech 100)
click to enlarge charts
Key Levels (1 to 3 weeks)
Intermediate resistance: 8300
Pivot (key resistance): 8370
Supports: 8000 & 7800
Next resistance 8500/560
Directional Bias (1 to 3 weeks)
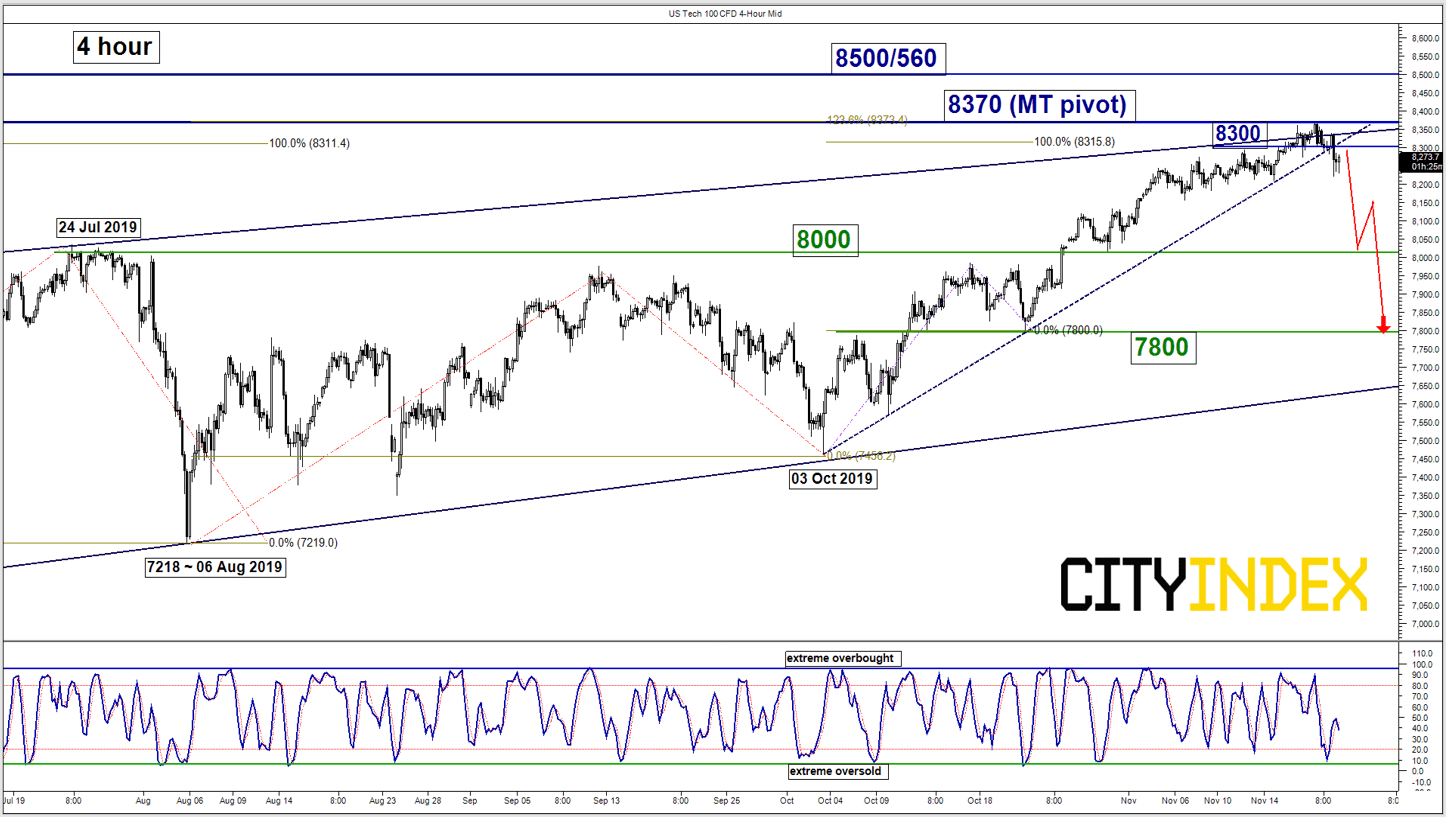
Bearish bias in US Tech 100 (proxy for Nasdaq 100 futures) below 8370 key medium-term pivotal resistance for a potential corrective decline to target the next support at 8000 and below exposes 7800 next.
On the other hand, a clearance with a daily close above 8370 invalidates the mean reversion decline scenario for a continuation of the impulsive upleg sequence to towards 8500/560 (Fibonacci expansion cluster) next in the first step.
Key elements
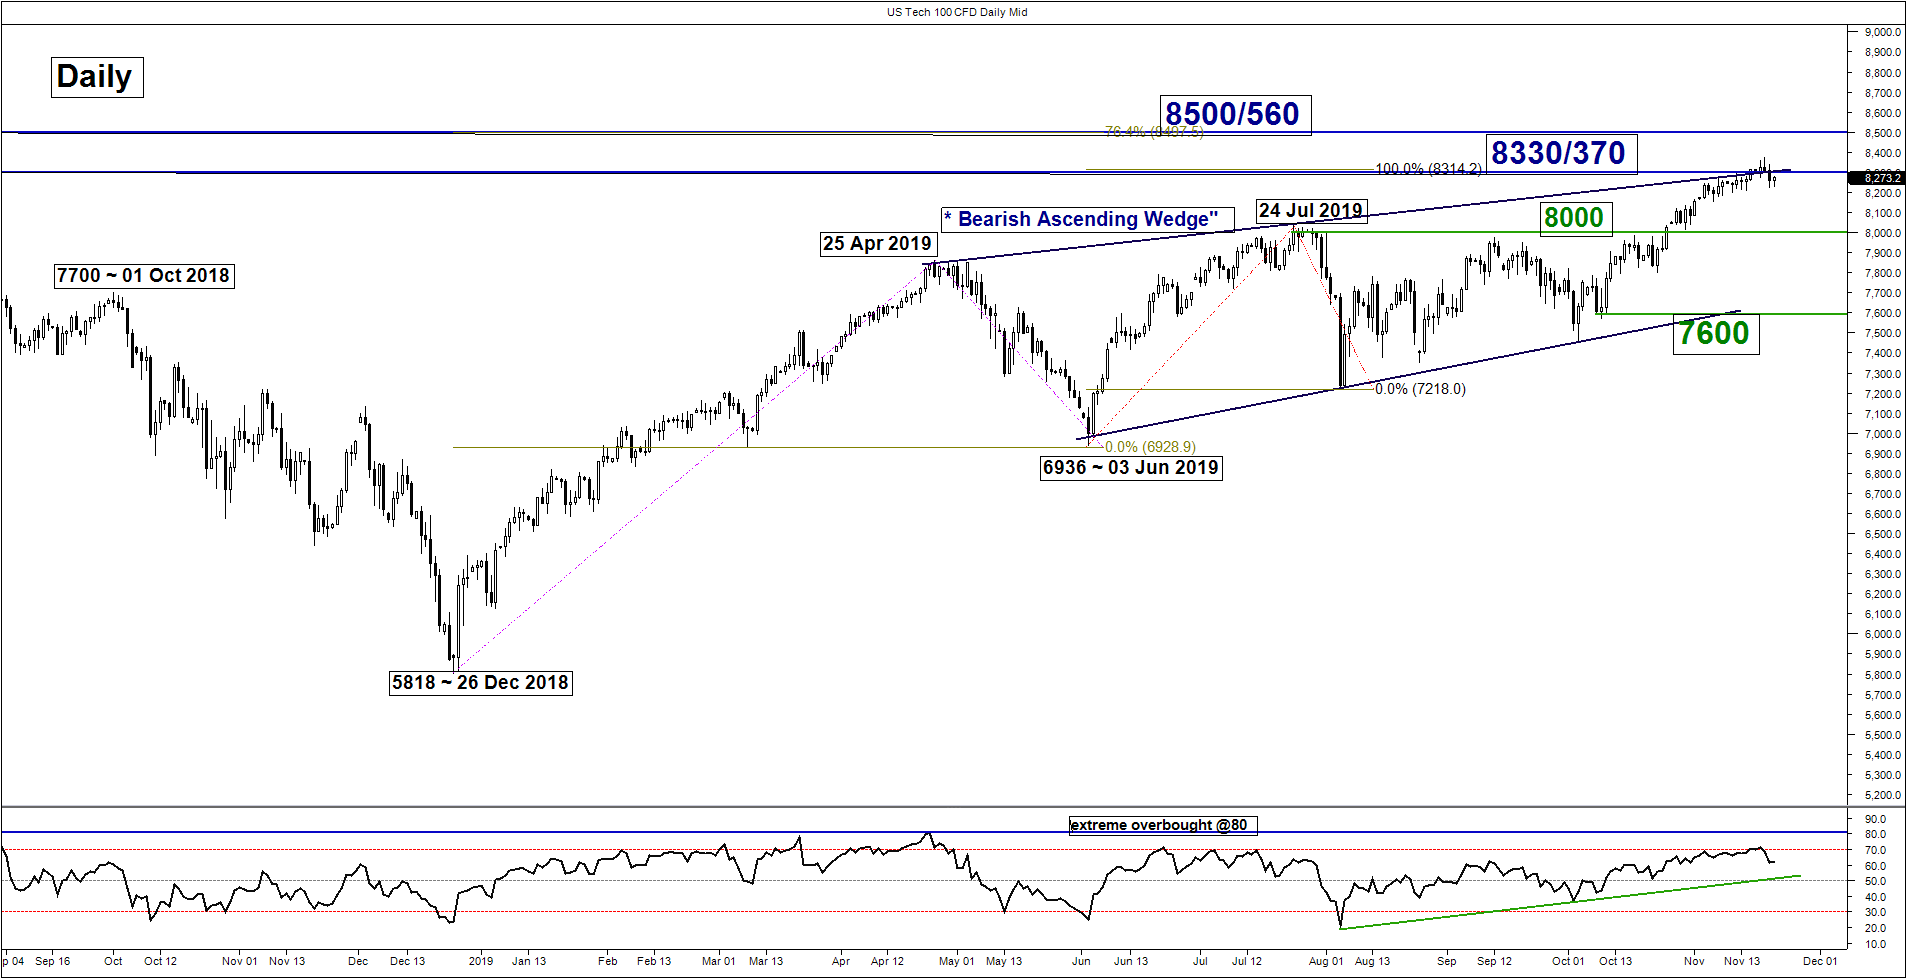
- The recent 7% rally from 23 Oct 2019 low of 7801 has tested the upper boundary of a medium-term bearish “Ascending Wedge” range configuration in place since 03 Jun 2019 low. Yesterday, 20 Nov, it has staged a 1% retreat from the “Ascending Wedge” resistance at 8330/370 which is also coincided with a Fibonacci expansion cluster (see daily chart)
- In the shorter-term (4-hour chart), the price action of the Index has staged a bearish breakdown from its minor ascending support from 03 Oct 2019 low now turns pull-back resistance at 8300. This observation suggests the minor uptrending phase has been damaged.
- The 7800 support is defined by the 22 Oct 2019 swing low and the 61.8% Fibonacci retracement of the recent up move from 03 Oct low to 19 Nov 2019 high.
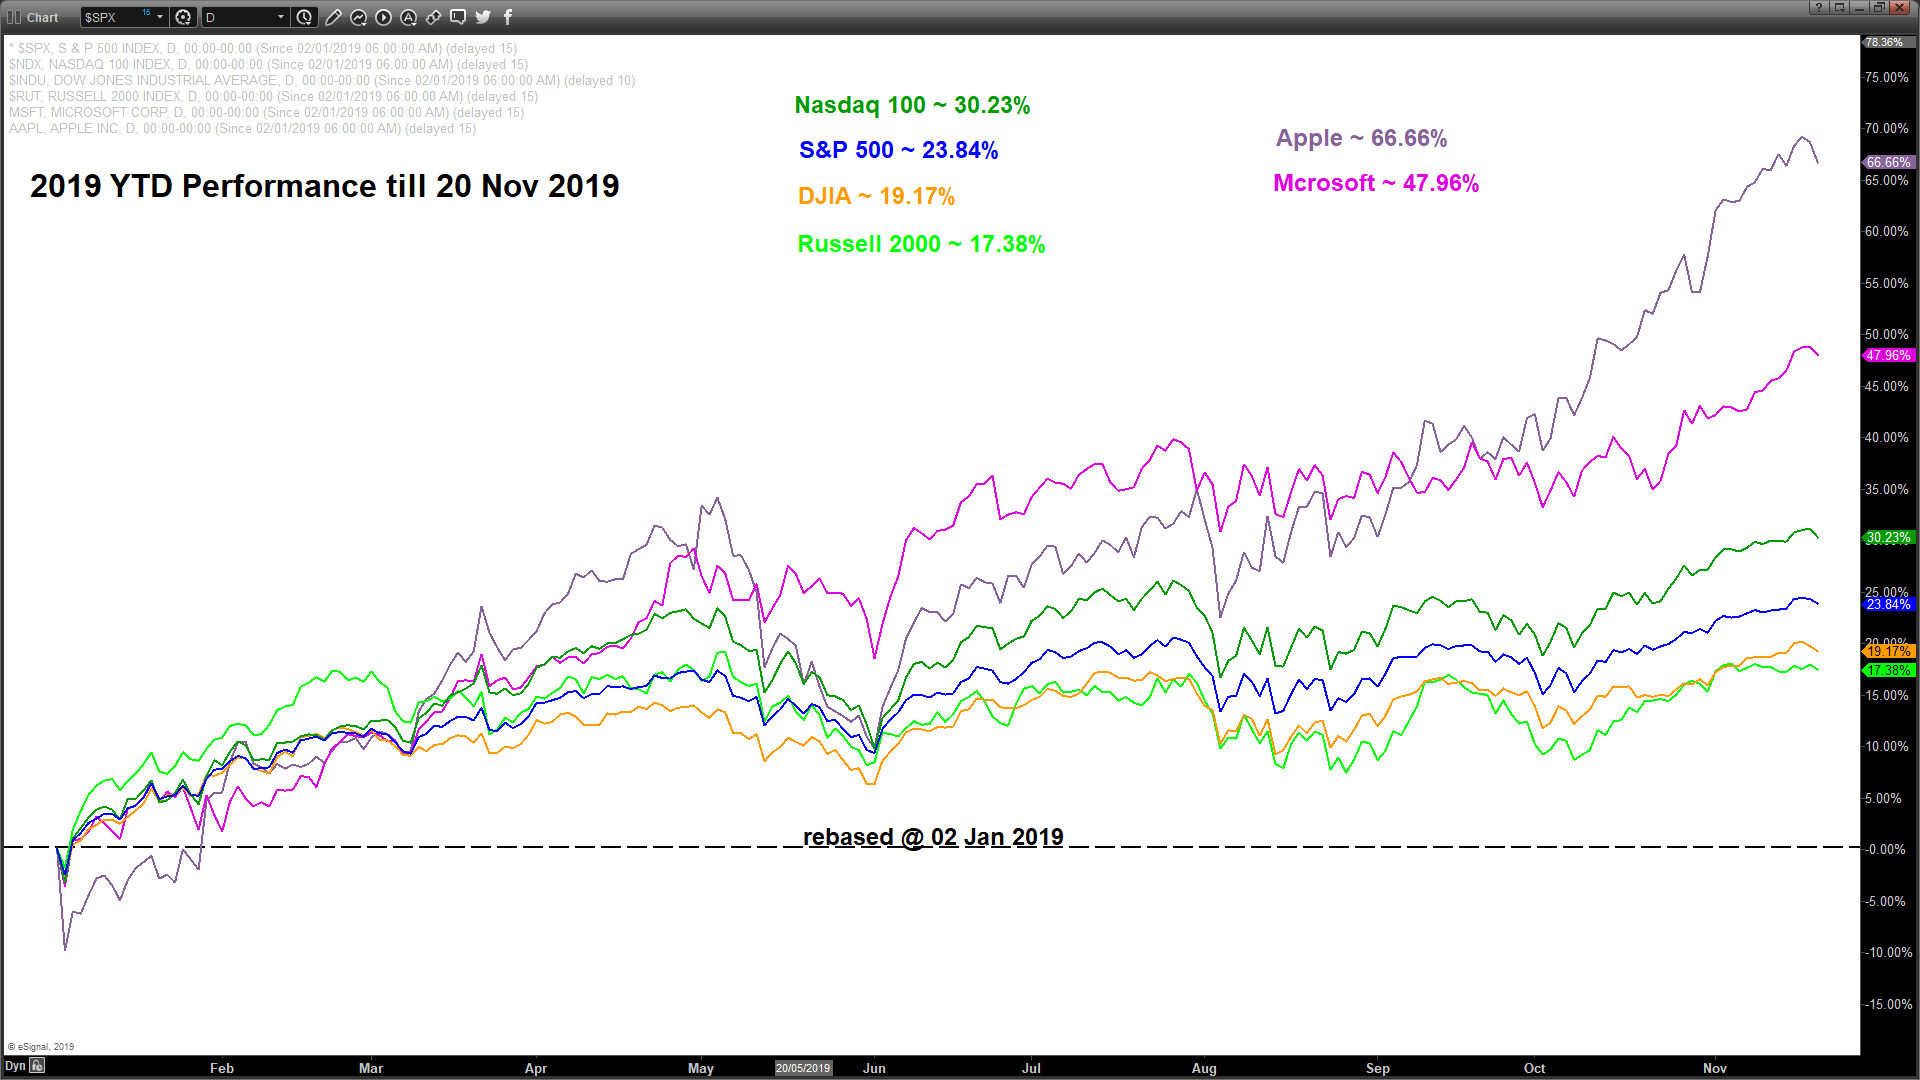
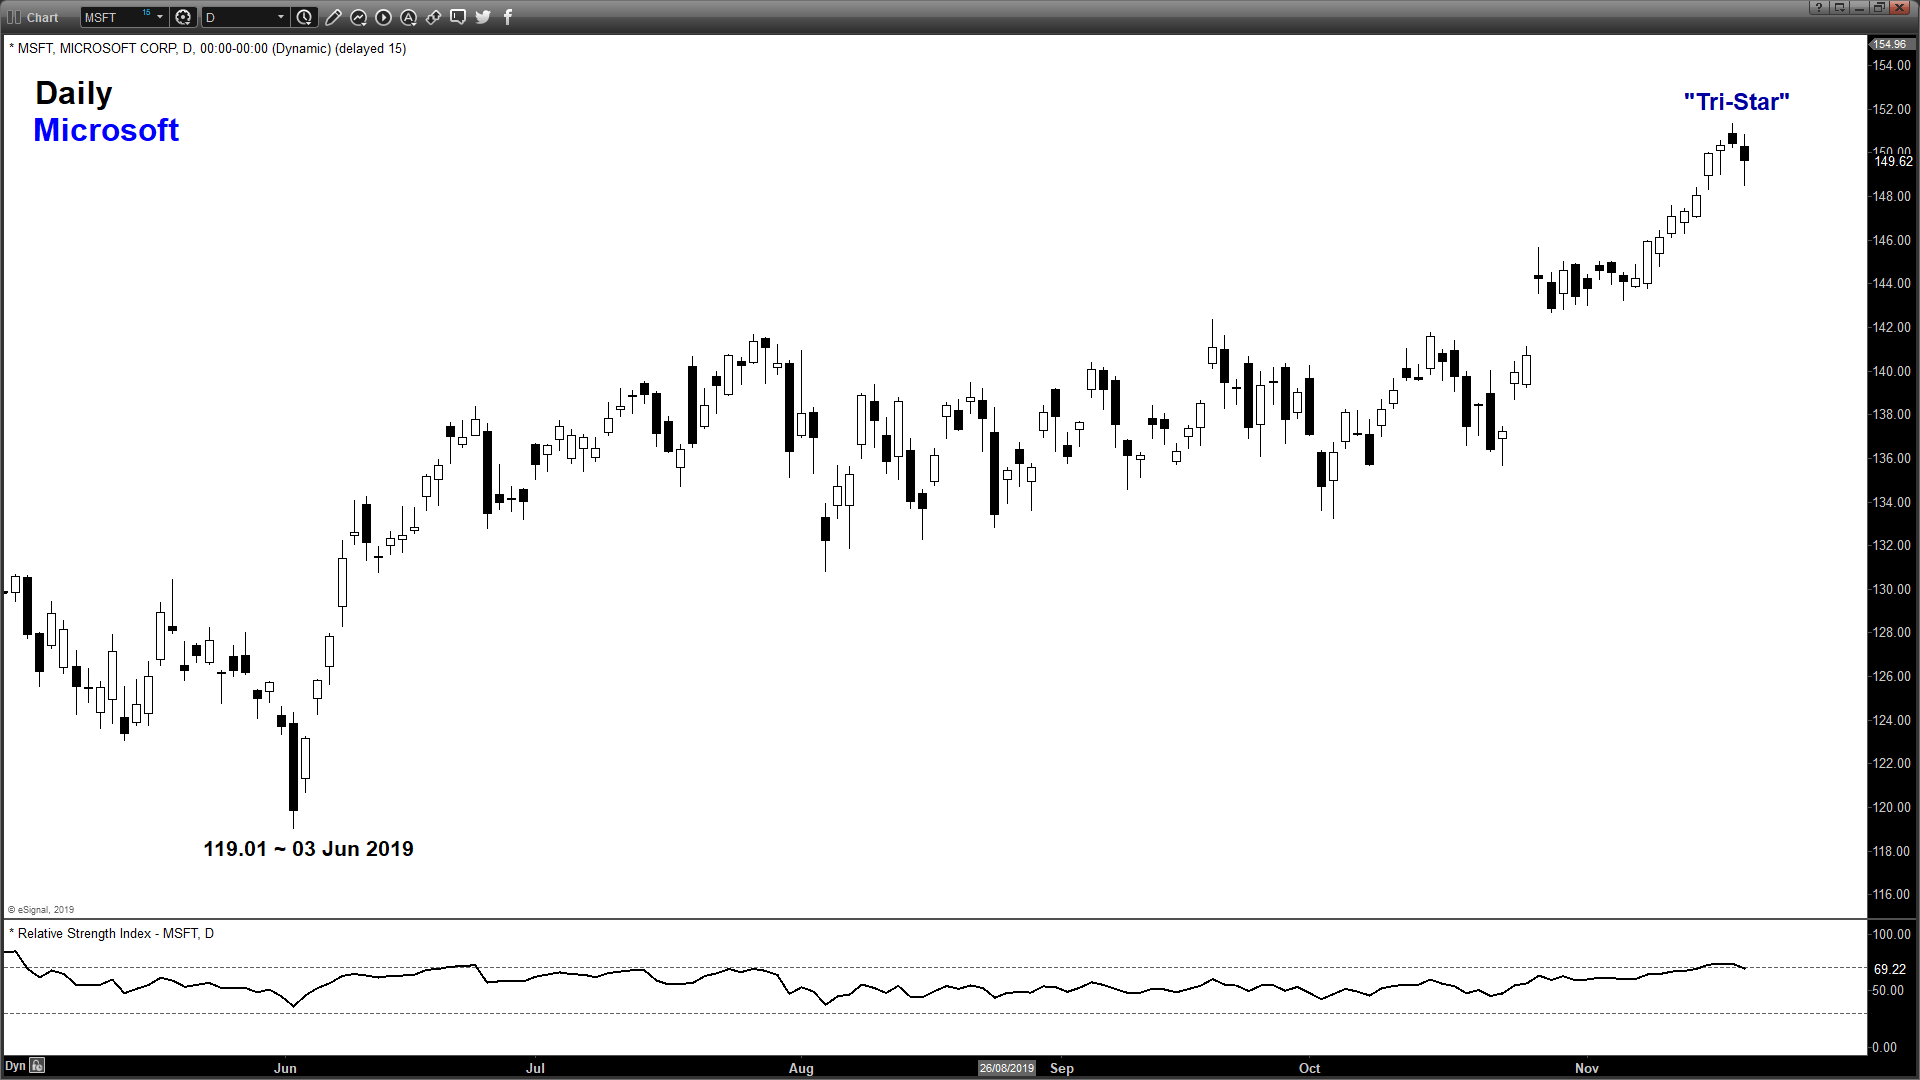
- Since the start of 2019, the Nasdaq 100 is the best performing major U.S. stock index (up by 30.23% excluding dividends) till 20 Nov 2019. Apple and Microsoft are the two component stocks that have the most significant contribution to the aggregate return of the Nasdaq 100 where Apple and Microsoft have recorded gains of 66.66% and 47.96% respectively.
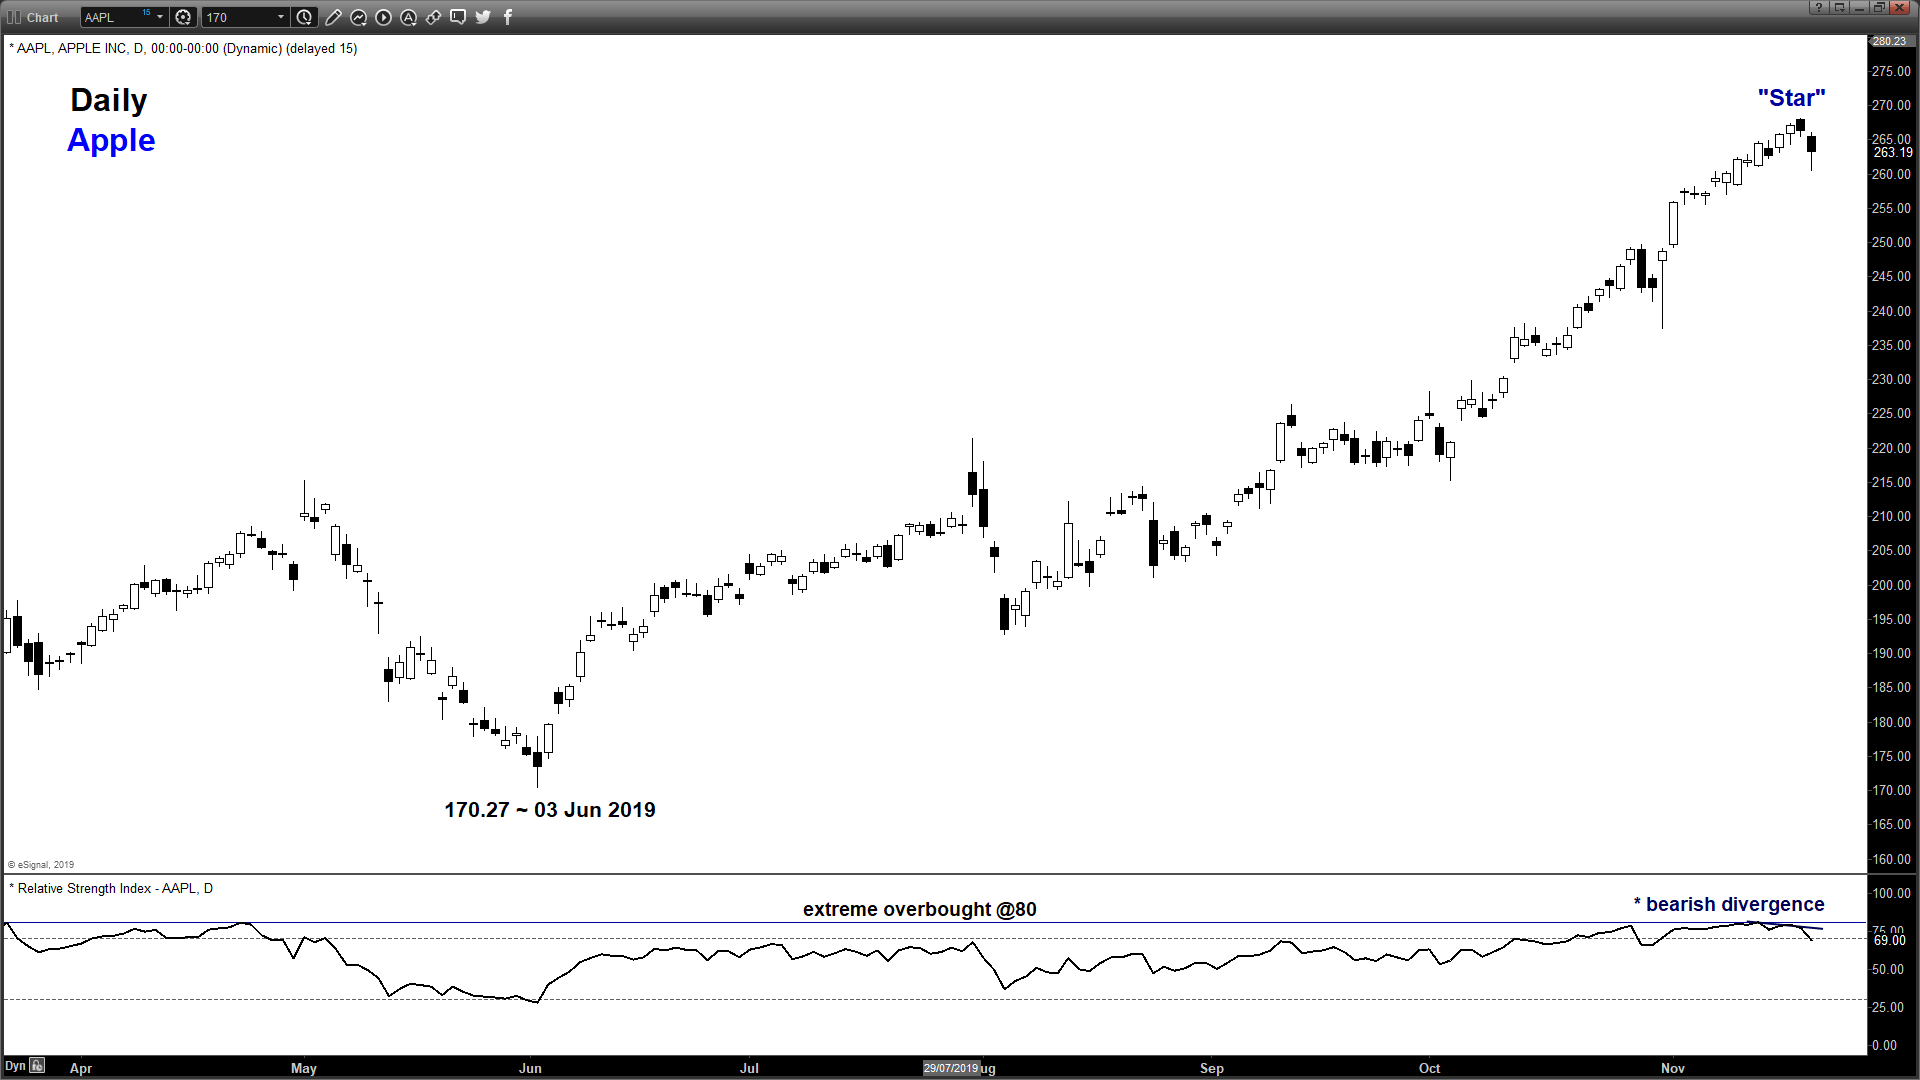
- The latest price action of Apple and Microsoft has started to show signs of bullish exhaustion after their significant run-up.
- Apple has formed a bearish daily candlestick at the close of yesterday, 20 Nov U.S. session after a prior “Star” candlestick formed on 19 Nov coupled with a bearish divergence signal seen on the daily RSI oscillator at an extreme overbought level.
- In conjunction, Microsoft has formed a “Tri-Star” bearish candlestick pattern, a configuration that takes into account of three session of price action (18 Nov, 19 Nov & 20 Nov). This type of candlestick pattern tends to indicate a potential mean reversion decline in price action after a significant rally,
Charts are from eSignal
Related Analysis:
Stock Indices Weekly Technical Outlook: New all-time high U.S stock market with euphoric mood
StoneX Financial Ltd (trading as “City Index”) is an execution-only service provider. This material, whether or not it states any opinions, is for general information purposes only and it does not take into account your personal circumstances or objectives. This material has been prepared using the thoughts and opinions of the author and these may change. However, City Index does not plan to provide further updates to any material once published and it is not under any obligation to keep this material up to date. This material is short term in nature and may only relate to facts and circumstances existing at a specific time or day. Nothing in this material is (or should be considered to be) financial, investment, legal, tax or other advice and no reliance should be placed on it.
No opinion given in this material constitutes a recommendation by City Index or the author that any particular investment, security, transaction or investment strategy is suitable for any specific person. The material has not been prepared in accordance with legal requirements designed to promote the independence of investment research. Although City Index is not specifically prevented from dealing before providing this material, City Index does not seek to take advantage of the material prior to its dissemination. This material is not intended for distribution to, or use by, any person in any country or jurisdiction where such distribution or use would be contrary to local law or regulation.
For further details see our full non-independent research disclaimer and quarterly summary.
CFDs are complex instruments and come with a high risk of losing money rapidly due to leverage. 69% of retail investor accounts lose money when trading CFDs with this provider. You should consider whether you understand how CFDs work and whether you can afford to take the high risk of losing your money. CFD and Forex Trading are leveraged products and your capital is at risk. They may not be suitable for everyone. Please ensure you fully understand the risks involved by reading our full risk warning.
City Index is a trading name of StoneX Financial Ltd. Head and Registered Office: 1st Floor, Moor House, 120 London Wall, London, EC2Y 5ET. StoneX Financial Ltd is a company registered in England and Wales, number: 05616586. Authorised and regulated by the Financial Conduct Authority. FCA Register Number: 446717.
City Index is a trademark of StoneX Financial Ltd.
The information on this website is not targeted at the general public of any particular country. It is not intended for distribution to residents in any country where such distribution or use would contravene any local law or regulatory requirement.
© City Index 2024