The USD JPY forecast for 2014
What were the key USD/JPY price movements of 2013?
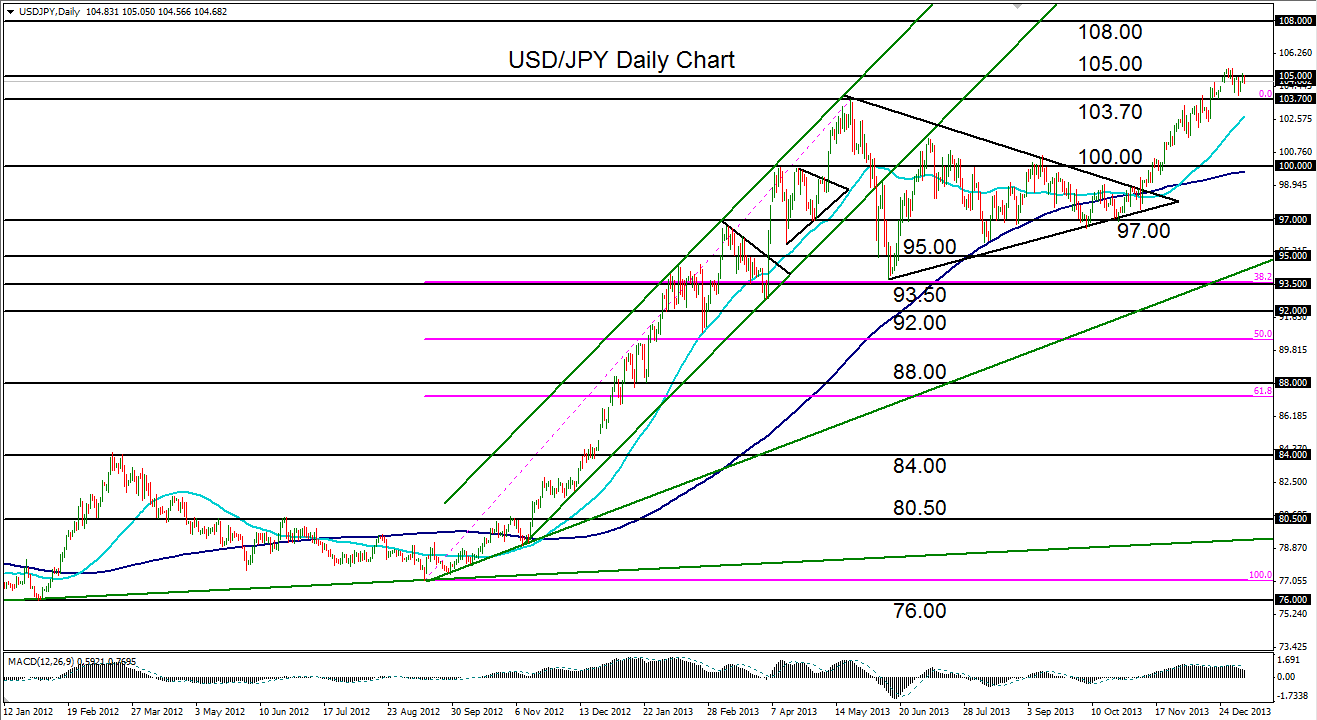
The theme for USD/JPY (a daily chart of which is shown) in 2013 was one of substantial yen weakening. The beginning of the year saw the currency pair just emerging from a long consolidation of low prices generally under the 84.00 level.
The beginning of what would turn out to be an exceptionally strong bullish trend actually began around the September 2012 low near 77.00. By the beginning of 2013, the climb was in full swing.
Subsequent months saw the pair climb swiftly, breaking out above successive resistance levels and forming a clear parallel uptrend channel. This climb continued in a steep and steady fashion until price hit a more than four-year high at 103.72 in May.
Immediately after this high was reached, the pair proceeded to plunge dramatically down to a low around 93.77 in June, which was also around the 38.2% Fibonacci retracement level of the prior bullish run from around 77.00 in September 2012 up to the noted 103.72 high.
From that low, USD/JPY proceeded to consolidate for the next five months within a large triangle pattern, only to break out to the upside in early November.
That breakout went on to reach its initial target around the key 100.00 psychological level, and then pushed swiftly higher to its second major target at the 103.00 resistance level by December. In mid-December, the pair broke out above its May high to establish a new five-year high.
Since mid-December, with very little in the way of pullback or correction, the pair advanced further to hit its upside target at 105.00 and then establish a new long-term high at 105.43.
Looking forward: My USD/JPY price predictions
Currently just below 105.43, USD/JPY continues to maintain a bullish outlook into 2014.
With a continuation of the strong and steep bullish trend now confirmed – after recently having established progressively higher highs – a major upside price objective now resides around 108.00, although a more significant pullback should soon be due.
Major downside support on this potential pullback currently resides around the 103.70 and then 101.50 price levels.
A break below the psychologically important 100.00 level should be watched with concern and could open up a move back towards the $96 and $94 support levels. Yet with continued efforts to maintain a weak currency to help induce an export lead economic revival, buyers could use any price drips in the cross pair as further buying opportunities.
Interested in what the year might bring for the other key currency pairs? Check out the other articles in this series:
GBP/USD forecast for 2014 and The EUR/USD forecast for 2014
StoneX Financial Ltd (trading as “City Index”) is an execution-only service provider. This material, whether or not it states any opinions, is for general information purposes only and it does not take into account your personal circumstances or objectives. This material has been prepared using the thoughts and opinions of the author and these may change. However, City Index does not plan to provide further updates to any material once published and it is not under any obligation to keep this material up to date. This material is short term in nature and may only relate to facts and circumstances existing at a specific time or day. Nothing in this material is (or should be considered to be) financial, investment, legal, tax or other advice and no reliance should be placed on it.
No opinion given in this material constitutes a recommendation by City Index or the author that any particular investment, security, transaction or investment strategy is suitable for any specific person. The material has not been prepared in accordance with legal requirements designed to promote the independence of investment research. Although City Index is not specifically prevented from dealing before providing this material, City Index does not seek to take advantage of the material prior to its dissemination. This material is not intended for distribution to, or use by, any person in any country or jurisdiction where such distribution or use would be contrary to local law or regulation.
For further details see our full non-independent research disclaimer and quarterly summary.
CFDs are complex instruments and come with a high risk of losing money rapidly due to leverage. 69% of retail investor accounts lose money when trading CFDs with this provider. You should consider whether you understand how CFDs work and whether you can afford to take the high risk of losing your money. CFD and Forex Trading are leveraged products and your capital is at risk. They may not be suitable for everyone. Please ensure you fully understand the risks involved by reading our full risk warning.
City Index is a trading name of StoneX Financial Ltd. Head and Registered Office: 1st Floor, Moor House, 120 London Wall, London, EC2Y 5ET. StoneX Financial Ltd is a company registered in England and Wales, number: 05616586. Authorised and regulated by the Financial Conduct Authority. FCA Register Number: 446717.
City Index is a trademark of StoneX Financial Ltd.
The information on this website is not targeted at the general public of any particular country. It is not intended for distribution to residents in any country where such distribution or use would contravene any local law or regulatory requirement.
© City Index 2024