The S amp P 500 technical analysis forecast for 2014
Looking back: S&P 500 price movements during 2013
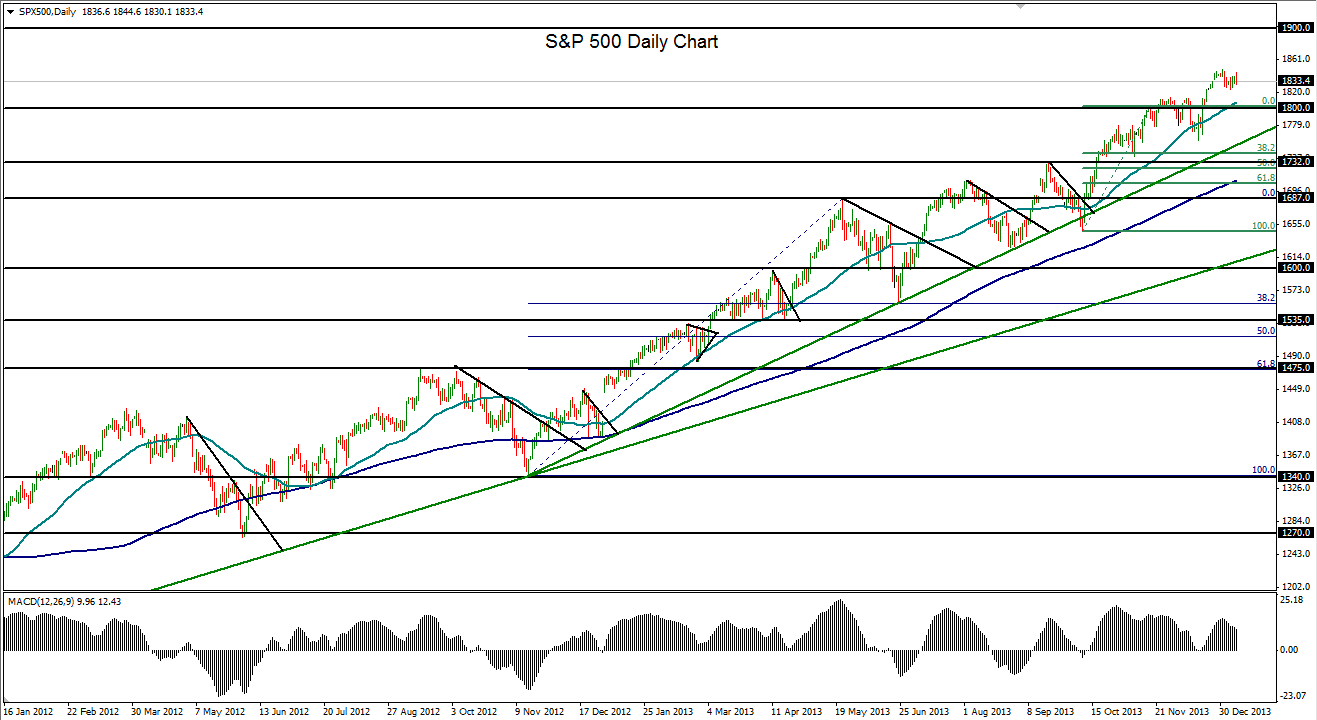
The S&P 500 (a daily chart of which is shown) consistently defied gravity in its relentlessly accelerating advance of 2013.
Despite several relatively shallow pullbacks throughout the year, the index continued to breakout to new highs. From its first historic close above 1600 in May, the S&P 500 continuously established higher all-time highs for the remainder of the year.
Neatly framing this remarkable climb has been an accelerated uptrend support line extending all the way back to the November 2012 low at 1342.
Throughout the course of 2013, the index corrected down to test this trend line on three separate occasions, but an expected rebound occurred each time.
Another bullish indicator lies in the relationship and positioning of the major moving averages. The 50-day moving average has consistently been rising well above the 200-day average, as has generally been the case since at least July 2012.
The very last day of 2013 saw the S&P 500 hit yet another record high, this time at 1849.
Looking forward: the S&P 500 forecast for 2014
The first several days of 2014 have seen a tight consolidation just under this new high.
Moving further into 2014, an overdue pullback should likely occur, although not necessarily one that would potentially deter or reverse the long-term bullish trend.
In the event of this pullback, a key support level currently resides around 1760. With a continuation of the entrenched uptrend on a breakout above the current record high, immediate price targets reside around 1900 and then the 2000 psychological level.
Interested in what the year might bring for the major currency pairs? Check out the other articles in this series:
GBP/USD forecast for 2014
EUR/USD forecast for 2014
USD/JPY forecast for 2014
AUD/USD forecast for 2014
You can also read James’ 2014 predictions on Gold, here.
StoneX Financial Ltd (trading as “City Index”) is an execution-only service provider. This material, whether or not it states any opinions, is for general information purposes only and it does not take into account your personal circumstances or objectives. This material has been prepared using the thoughts and opinions of the author and these may change. However, City Index does not plan to provide further updates to any material once published and it is not under any obligation to keep this material up to date. This material is short term in nature and may only relate to facts and circumstances existing at a specific time or day. Nothing in this material is (or should be considered to be) financial, investment, legal, tax or other advice and no reliance should be placed on it.
No opinion given in this material constitutes a recommendation by City Index or the author that any particular investment, security, transaction or investment strategy is suitable for any specific person. The material has not been prepared in accordance with legal requirements designed to promote the independence of investment research. Although City Index is not specifically prevented from dealing before providing this material, City Index does not seek to take advantage of the material prior to its dissemination. This material is not intended for distribution to, or use by, any person in any country or jurisdiction where such distribution or use would be contrary to local law or regulation.
For further details see our full non-independent research disclaimer and quarterly summary.
CFDs are complex instruments and come with a high risk of losing money rapidly due to leverage. 69% of retail investor accounts lose money when trading CFDs with this provider. You should consider whether you understand how CFDs work and whether you can afford to take the high risk of losing your money. CFD and Forex Trading are leveraged products and your capital is at risk. They may not be suitable for everyone. Please ensure you fully understand the risks involved by reading our full risk warning.
City Index is a trading name of StoneX Financial Ltd. Head and Registered Office: 1st Floor, Moor House, 120 London Wall, London, EC2Y 5ET. StoneX Financial Ltd is a company registered in England and Wales, number: 05616586. Authorised and regulated by the Financial Conduct Authority. FCA Register Number: 446717.
City Index is a trademark of StoneX Financial Ltd.
The information on this website is not targeted at the general public of any particular country. It is not intended for distribution to residents in any country where such distribution or use would contravene any local law or regulatory requirement.
© City Index 2024