The Path Of Least Resistance Points Lower For Gold
As long as 1480 holds as resistance and trade headlines remain favourable, the path of least resistance points lower for gold.
Yesterday we noted that yen pairs were testing key support levels whilst the elusive ‘phase one’ trade deal sat on a knife’s edge. Well it was no surprise to see gold (a safe-haven during times of turmoil) probing resistance, as a break lower on JPY pairs would have assumed a break higher on gold prices. Yet with developing headlines favouring a mild risk-on appetite later in the sessions, JPY held above support and gold turned lower from resistance.
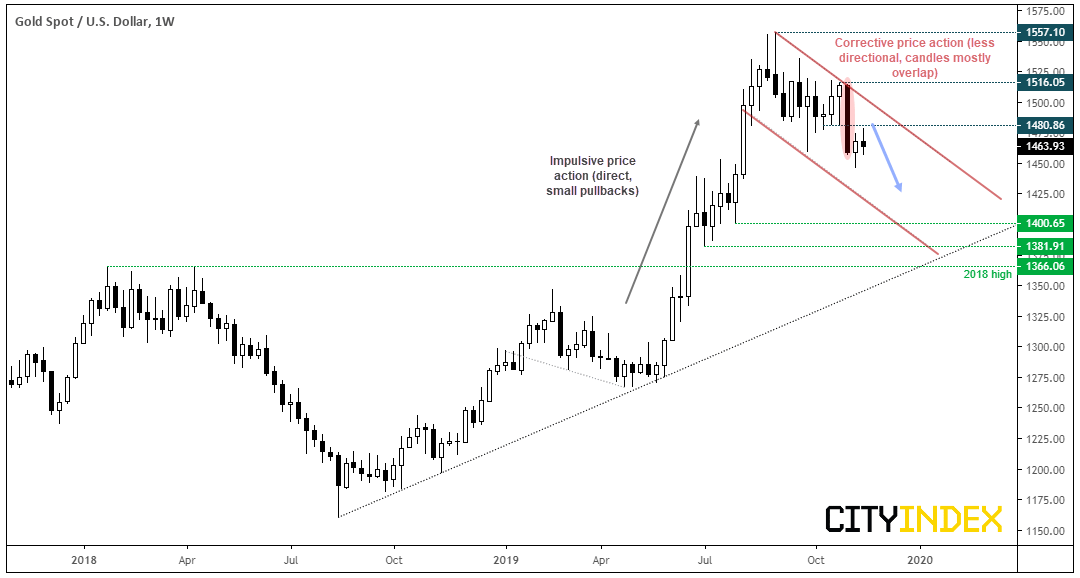
Due to price action behaviour since the 1557, gold appears to remain in a correction from its highs and could print new lows. Moreover, it remains overextended from its bullish trendline and the elongated bearish candle two weeks ago shows bears are in control overall.
If the US-China headlines remain skewed to the upside, it could continue to weigh on gold and force prices lower. Over the near-term, 1480 needs to cap as resistance for the bearish bias to play out. On the weekly chart, prices continue to look extended from its July trendline despite suffering its worst weekly close in 3 years. And it appears gold is to close the week with another doji below resistance.
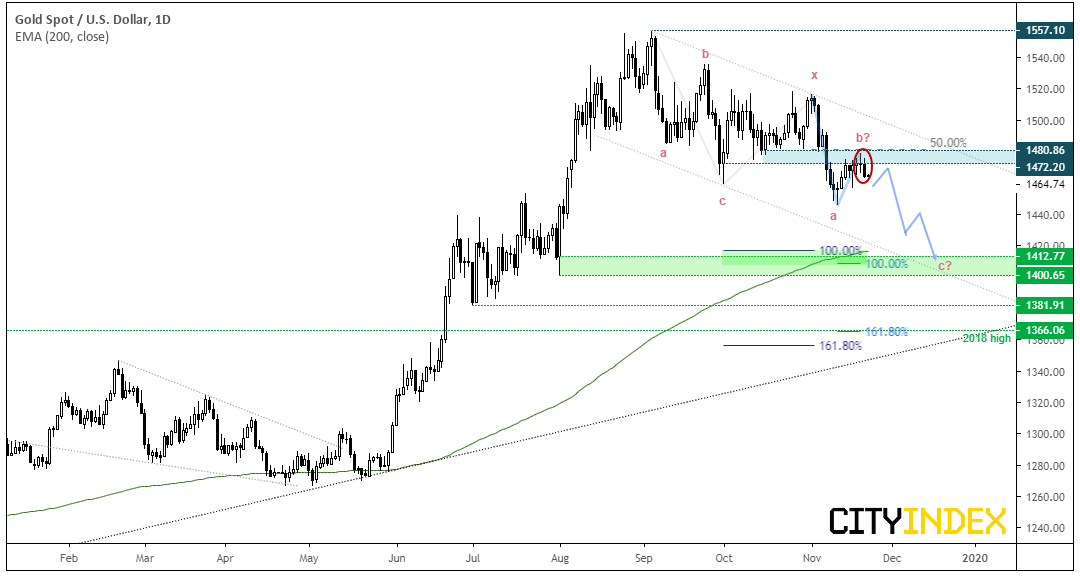
Since prior analysis, gold made a minor new low before gently retracing towards the 1480 area. It remains in a bearish channel which could allow for further upside before turning notably lower, yet there’s a decent zone of resistance around 1472-1480 which is currently capping any upside. For now, it looks like resistance could hold around the 50% retracement level. Also notice that prices have failed multiple times to close above 1472.20, which is the close low on the 31st of October.
Momentum is beginning to turn lower once more. Yesterday’s bearish engulfing candle closed at a 6-day low and confirmed the series of hammers and doji’s as near-term tops. So long as 1480 holds as resistance, we could be in the final C-wave of a double zig-zag correction from the 1557 high, which projects an approximate target around 1412.
- Near-term bias remains bearish below 1480.
- Bears could target 1420, which is just above two 100% Fibonacci projections and near the 200-day eMA. Interestingly, two 161.38% bearish projections also stall in the same area around 1366 and near the bullish trendline, making it an area to consider for a lower target if bearish momentum persists.
- At this stage, a break above 1480 simply suggests wave b is to be a little deeper. We would then look for the bearish channel to hold as resistance before its next leg lower.
Related Analysis:
Yen Pairs Test Key Support Whilst ‘Phase One’ Sits On A Knife's Edge
Gold’s Worst Week in 3 Years Sees Bears Firmly Back In Control
StoneX Financial Ltd (trading as “City Index”) is an execution-only service provider. This material, whether or not it states any opinions, is for general information purposes only and it does not take into account your personal circumstances or objectives. This material has been prepared using the thoughts and opinions of the author and these may change. However, City Index does not plan to provide further updates to any material once published and it is not under any obligation to keep this material up to date. This material is short term in nature and may only relate to facts and circumstances existing at a specific time or day. Nothing in this material is (or should be considered to be) financial, investment, legal, tax or other advice and no reliance should be placed on it.
No opinion given in this material constitutes a recommendation by City Index or the author that any particular investment, security, transaction or investment strategy is suitable for any specific person. The material has not been prepared in accordance with legal requirements designed to promote the independence of investment research. Although City Index is not specifically prevented from dealing before providing this material, City Index does not seek to take advantage of the material prior to its dissemination. This material is not intended for distribution to, or use by, any person in any country or jurisdiction where such distribution or use would be contrary to local law or regulation.
For further details see our full non-independent research disclaimer and quarterly summary.
CFDs are complex instruments and come with a high risk of losing money rapidly due to leverage. 69% of retail investor accounts lose money when trading CFDs with this provider. You should consider whether you understand how CFDs work and whether you can afford to take the high risk of losing your money. CFD and Forex Trading are leveraged products and your capital is at risk. They may not be suitable for everyone. Please ensure you fully understand the risks involved by reading our full risk warning.
City Index is a trading name of StoneX Financial Ltd. Head and Registered Office: 1st Floor, Moor House, 120 London Wall, London, EC2Y 5ET. StoneX Financial Ltd is a company registered in England and Wales, number: 05616586. Authorised and regulated by the Financial Conduct Authority. FCA Register Number: 446717.
City Index is a trademark of StoneX Financial Ltd.
The information on this website is not targeted at the general public of any particular country. It is not intended for distribution to residents in any country where such distribution or use would contravene any local law or regulatory requirement.
© City Index 2024