The Long View Will NZDUSD Hit a 6 Year Low Down Near 6400
The recent price action in the New Zealand dollar provides a perfect example of how a rapid shift in monetary policy expectations can lead to a massive move in the FX market. Over a period of just two months, the RBNZ has shifted from a tightening bias on monetary policy to outright easing, with traders pricing in another one or two interest rate cuts this year in addition to the one we saw two weeks ago. NZDUSD has been absolutely walloped as a result, with the pair falling nearly 1,000 pips, or nearly 13%, over the last two months alone.
Unfortunately for kiwi bulls, it may be awhile longer before NZDUSD can stem its bleeding. Last week’s abysmal New Zealand Q1 GDP reading already has some analysts calling for another 25bps interest rate cut at the RBNZ’s meeting next month, while the US Federal Reserve seems to have its heart set on hiking interest rates at least once (and maybe even twice if the Fed’s “dot chart” is to be believed) later this year.
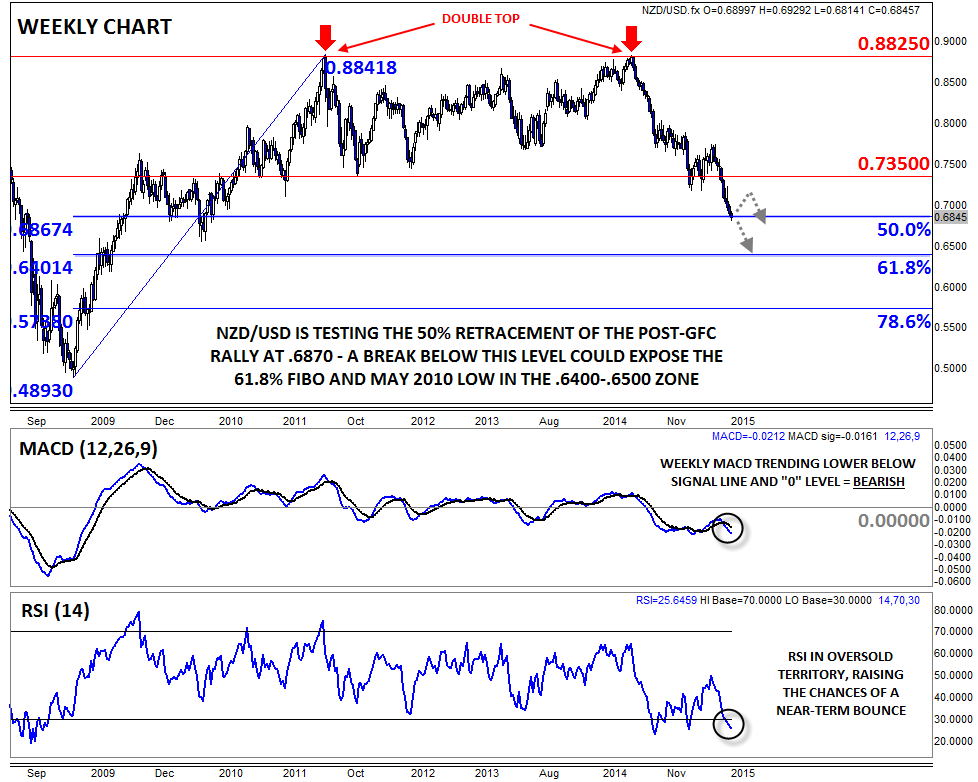
On a technical basis, NZDUSD is on the verge of a major long-term breakdown below the 50% retracement of the entire post-GFC rally from below .5000 to nearly .9000 at .6870. Bolstering the bearish case, the weekly MACD indicator has rolled over and is now trending lower below both its signal line and the “0” level, though the oversold reading on the weekly RSI could lead to a short-term bounce.
Taking a step back, the most recent drop comes on the back of a massive, multi-year double top pattern at the .8825 level; if this pattern reaches maturity, it would suggest a measured move objective all the way down below .6000! More immediately, a weekly close below the 50% retracement at .6870 would open the door for another leg down toward the May 2010 low near .6500 or the 61.8% Fibonacci retracement around .6400 as we head into Q3.
StoneX Financial Ltd (trading as “City Index”) is an execution-only service provider. This material, whether or not it states any opinions, is for general information purposes only and it does not take into account your personal circumstances or objectives. This material has been prepared using the thoughts and opinions of the author and these may change. However, City Index does not plan to provide further updates to any material once published and it is not under any obligation to keep this material up to date. This material is short term in nature and may only relate to facts and circumstances existing at a specific time or day. Nothing in this material is (or should be considered to be) financial, investment, legal, tax or other advice and no reliance should be placed on it.
No opinion given in this material constitutes a recommendation by City Index or the author that any particular investment, security, transaction or investment strategy is suitable for any specific person. The material has not been prepared in accordance with legal requirements designed to promote the independence of investment research. Although City Index is not specifically prevented from dealing before providing this material, City Index does not seek to take advantage of the material prior to its dissemination. This material is not intended for distribution to, or use by, any person in any country or jurisdiction where such distribution or use would be contrary to local law or regulation.
For further details see our full non-independent research disclaimer and quarterly summary.
CFDs are complex instruments and come with a high risk of losing money rapidly due to leverage. 69% of retail investor accounts lose money when trading CFDs with this provider. You should consider whether you understand how CFDs work and whether you can afford to take the high risk of losing your money. CFD and Forex Trading are leveraged products and your capital is at risk. They may not be suitable for everyone. Please ensure you fully understand the risks involved by reading our full risk warning.
City Index is a trading name of StoneX Financial Ltd. Head and Registered Office: 1st Floor, Moor House, 120 London Wall, London, EC2Y 5ET. StoneX Financial Ltd is a company registered in England and Wales, number: 05616586. Authorised and regulated by the Financial Conduct Authority. FCA Register Number: 446717.
City Index is a trademark of StoneX Financial Ltd.
The information on this website is not targeted at the general public of any particular country. It is not intended for distribution to residents in any country where such distribution or use would contravene any local law or regulatory requirement.
© City Index 2024