The Gold Silver Ratio Could Pay Handsomely In Silver
The Gold/Silver Ratio Could Pay Handsomely In Silver
Price action on the gold/silver ratio suggests a correction could be underway, to Silver’s advantage.
It goes without saying that gold has had a stellar couple of months and, given the backdrop of global negative yields and the potential for a Fed easing cycle (even though they currently deny this), we expect gold’s trend to push higher as the year develops.
Indeed, it was the June Fed meeting which saw gold explode to new highs and break key resistance, which suggests dominant momentum has realigned with its longer-term secular trend. If that is the case, we’d also expect record new highs over the coming years.
The renewed lust for gold has also seen demand for silver rise which has seen large speculators net-long for 10-consecutive weeks. And, whilst gold remains the key driver behind the move, perhaps Silver has some catching up to do on a relative basis to gold. And this is where the gold/silver ratio becomes interesting.
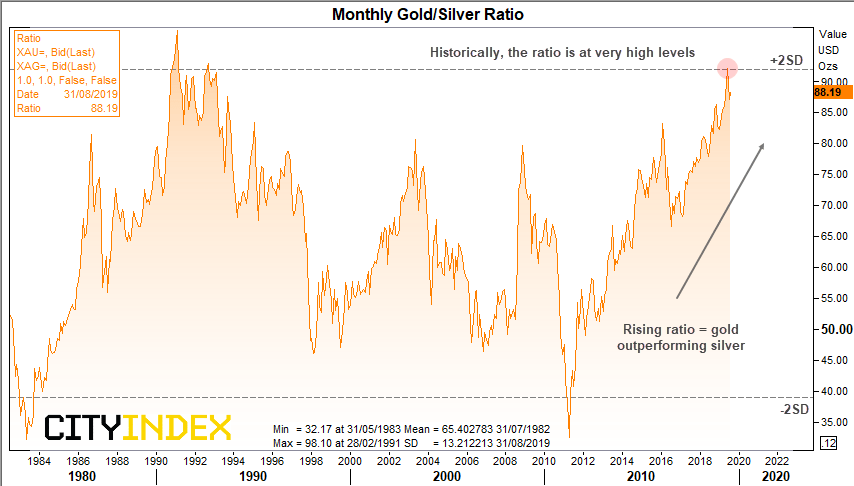
The gold/silver ratio essentially shows us how many bars of silver it takes to buy an ounce of gold. Currently around 88, the gold/silver ratio hit its highest level in 27 years in June after trading above + standard deviations from its long-term average. Whilst the ratio remains in a clear uptrend, there are signs of over-extension, to suggest silver could outperform gold over the coming months.
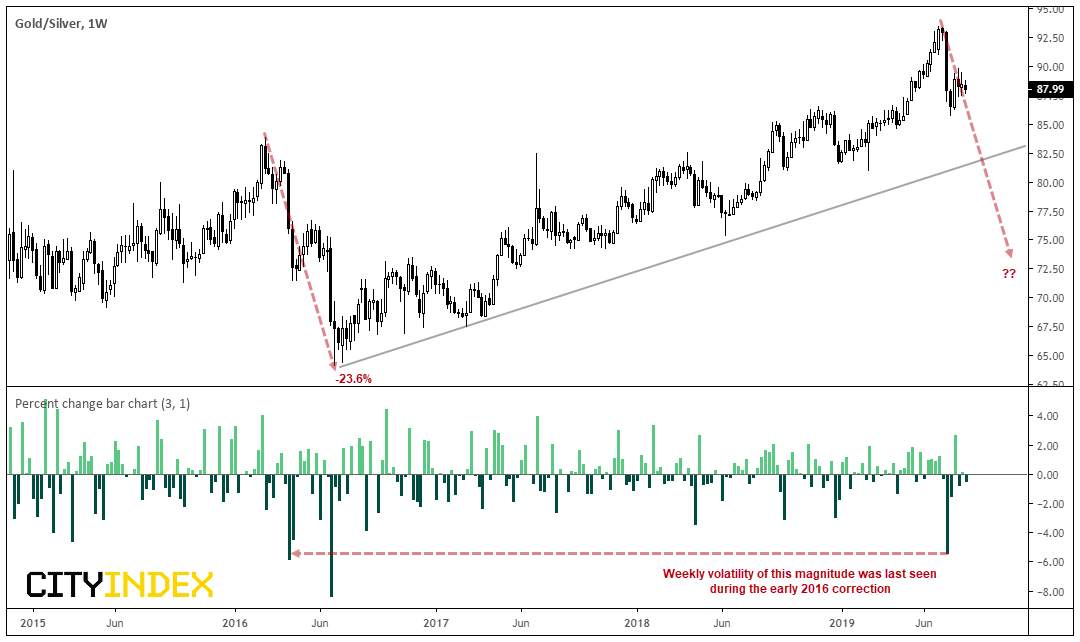
Taking a closer look at the weekly candles, the ratio fell over -5% mid-July, amid its most bearish week since May 2016. In fact, such levels of volatility have not been seen since H1 2016 when investors were also fretting about a China slowdown and global growth. In fact, the ratio fell 23.6% over an 18-week period as silver outperformed gold from the end of February 2016. If a 20% or more drop were to occur during this correction the ratio could fall below 75 whilst Silver closed its gap with gold’s tailwind.
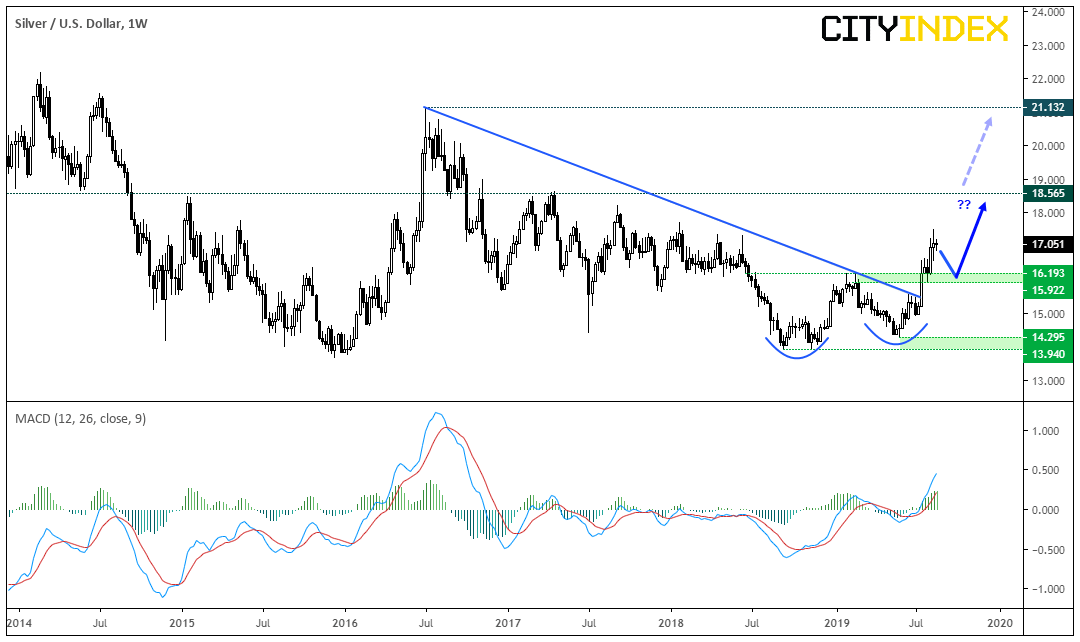
Switching to silver (XAG/USD) we can see it has recently broken out of a basing pattern and invalidated a bearish trendline. Furthermore, the MACD is above its signal line and zero to show a build-up of bullish momentum.
- As metals could be headed for a pullback, bulls could consider buying dips above the $16 support zone ($1592-$16.19 to be precise) with a view to target the $18.56 and $21.12 highs over the near-term.
- However, if the ratio is to perform a double-digit correction, Silver could indeed break to new highs.
- A break back below places it onto the backburner, a break beneath the $14 lows invalidates the bullish bias.
Related analysis:
Has Gold Moved Too Far, Too Fast?
Bitcoin And Gold's Divergence Could Be About To Get Tested
Gold Explodes To 5-Year High Post-FOMC
StoneX Financial Ltd (trading as “City Index”) is an execution-only service provider. This material, whether or not it states any opinions, is for general information purposes only and it does not take into account your personal circumstances or objectives. This material has been prepared using the thoughts and opinions of the author and these may change. However, City Index does not plan to provide further updates to any material once published and it is not under any obligation to keep this material up to date. This material is short term in nature and may only relate to facts and circumstances existing at a specific time or day. Nothing in this material is (or should be considered to be) financial, investment, legal, tax or other advice and no reliance should be placed on it.
No opinion given in this material constitutes a recommendation by City Index or the author that any particular investment, security, transaction or investment strategy is suitable for any specific person. The material has not been prepared in accordance with legal requirements designed to promote the independence of investment research. Although City Index is not specifically prevented from dealing before providing this material, City Index does not seek to take advantage of the material prior to its dissemination. This material is not intended for distribution to, or use by, any person in any country or jurisdiction where such distribution or use would be contrary to local law or regulation.
For further details see our full non-independent research disclaimer and quarterly summary.
CFDs are complex instruments and come with a high risk of losing money rapidly due to leverage. 69% of retail investor accounts lose money when trading CFDs with this provider. You should consider whether you understand how CFDs work and whether you can afford to take the high risk of losing your money. CFD and Forex Trading are leveraged products and your capital is at risk. They may not be suitable for everyone. Please ensure you fully understand the risks involved by reading our full risk warning.
City Index is a trading name of StoneX Financial Ltd. Head and Registered Office: 1st Floor, Moor House, 120 London Wall, London, EC2Y 5ET. StoneX Financial Ltd is a company registered in England and Wales, number: 05616586. Authorised and regulated by the Financial Conduct Authority. FCA Register Number: 446717.
City Index is a trademark of StoneX Financial Ltd.
The information on this website is not targeted at the general public of any particular country. It is not intended for distribution to residents in any country where such distribution or use would contravene any local law or regulatory requirement.
© City Index 2024