The FTSE 100 technical analysis forecast for 2014
What did we see from the FTSE in 2013?
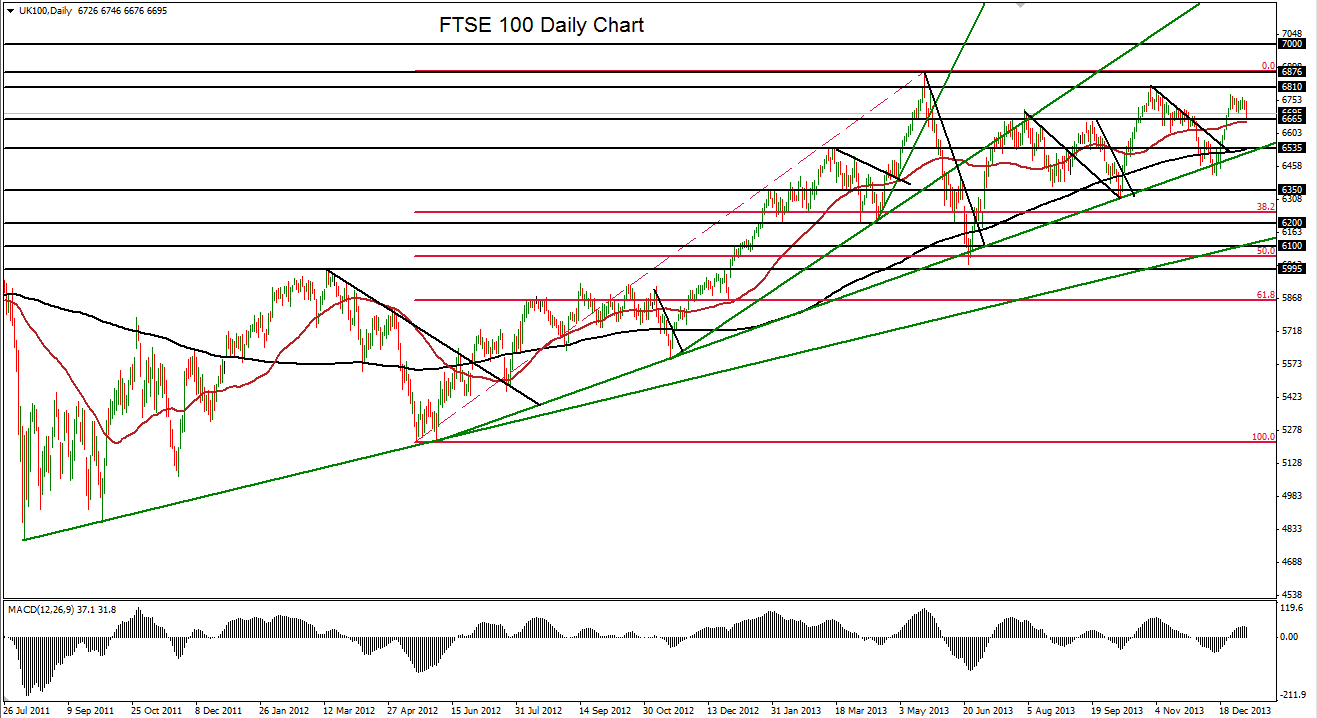
The FTSE 100 (a daily chart of which is shown) has shown little sign of relenting in its long bullish run that has closely mirrored other major global indices.
From its most recent significant upswing to the 6819 peak at the end of October 2013, the FTSE corrected down by almost six percent to its December low of 6417, before rebounding.
This rebound occurred in a highly significant technical price area, as it closely conformed to a major bullish trend line extending back to the mid-2012 lows at around 5225.
FTSE technical analysis chart
The index dipped slightly below this trend line, as it did after a similar correction in June, but the rebound that began in mid-December has been swift and sure – breaking out above a short-term counter-trend resistance line drawn from the noted 6819 high.
This rebound provides a strong technical indication of the continuing strength of the entrenched uptrend after the most recent corrective pullback.
The 50-day moving average is also rising steadily above the 200-day average, which has generally been the case since August 2012.
The FTSE forecast for 2014 – what could we expect?
Currently, the index has been in a tight flag-like consolidation since the beginning of 2014, not far below its October 6819 high.
Moving further into 2014, the FTSE will need to break above its long-term high of 6876 (established in May 2013) in order to assert a continuation of the entrenched bullish trend.
Such a breakout could put the index on track to target first its 6950 all-time high (established at the end of 1999), and then potentially the 7000 psychological resistance level.
Key downside support on another potential pullback currently resides around the 6530 level.
Interested in what the year might bring for the major currency pairs? Check out the other articles in this series:
GBP/USD forecast for 2014
EUR/USD forecast for 2014
USD/JPY forecast for 2014
AUD/USD forecast for 2014
You can also read James’ 2014 predictions on Gold, here.
StoneX Financial Ltd (trading as “City Index”) is an execution-only service provider. This material, whether or not it states any opinions, is for general information purposes only and it does not take into account your personal circumstances or objectives. This material has been prepared using the thoughts and opinions of the author and these may change. However, City Index does not plan to provide further updates to any material once published and it is not under any obligation to keep this material up to date. This material is short term in nature and may only relate to facts and circumstances existing at a specific time or day. Nothing in this material is (or should be considered to be) financial, investment, legal, tax or other advice and no reliance should be placed on it.
No opinion given in this material constitutes a recommendation by City Index or the author that any particular investment, security, transaction or investment strategy is suitable for any specific person. The material has not been prepared in accordance with legal requirements designed to promote the independence of investment research. Although City Index is not specifically prevented from dealing before providing this material, City Index does not seek to take advantage of the material prior to its dissemination. This material is not intended for distribution to, or use by, any person in any country or jurisdiction where such distribution or use would be contrary to local law or regulation.
For further details see our full non-independent research disclaimer and quarterly summary.
CFDs are complex instruments and come with a high risk of losing money rapidly due to leverage. 69% of retail investor accounts lose money when trading CFDs with this provider. You should consider whether you understand how CFDs work and whether you can afford to take the high risk of losing your money. CFD and Forex Trading are leveraged products and your capital is at risk. They may not be suitable for everyone. Please ensure you fully understand the risks involved by reading our full risk warning.
City Index is a trading name of StoneX Financial Ltd. Head and Registered Office: 1st Floor, Moor House, 120 London Wall, London, EC2Y 5ET. StoneX Financial Ltd is a company registered in England and Wales, number: 05616586. Authorised and regulated by the Financial Conduct Authority. FCA Register Number: 446717.
City Index is a trademark of StoneX Financial Ltd.
The information on this website is not targeted at the general public of any particular country. It is not intended for distribution to residents in any country where such distribution or use would contravene any local law or regulatory requirement.
© City Index 2024