Texas Instruments eyeing another new all time high
Texas Instruments (TXN)
click to enlarge charts
Key Levels (1 to 3 weeks)
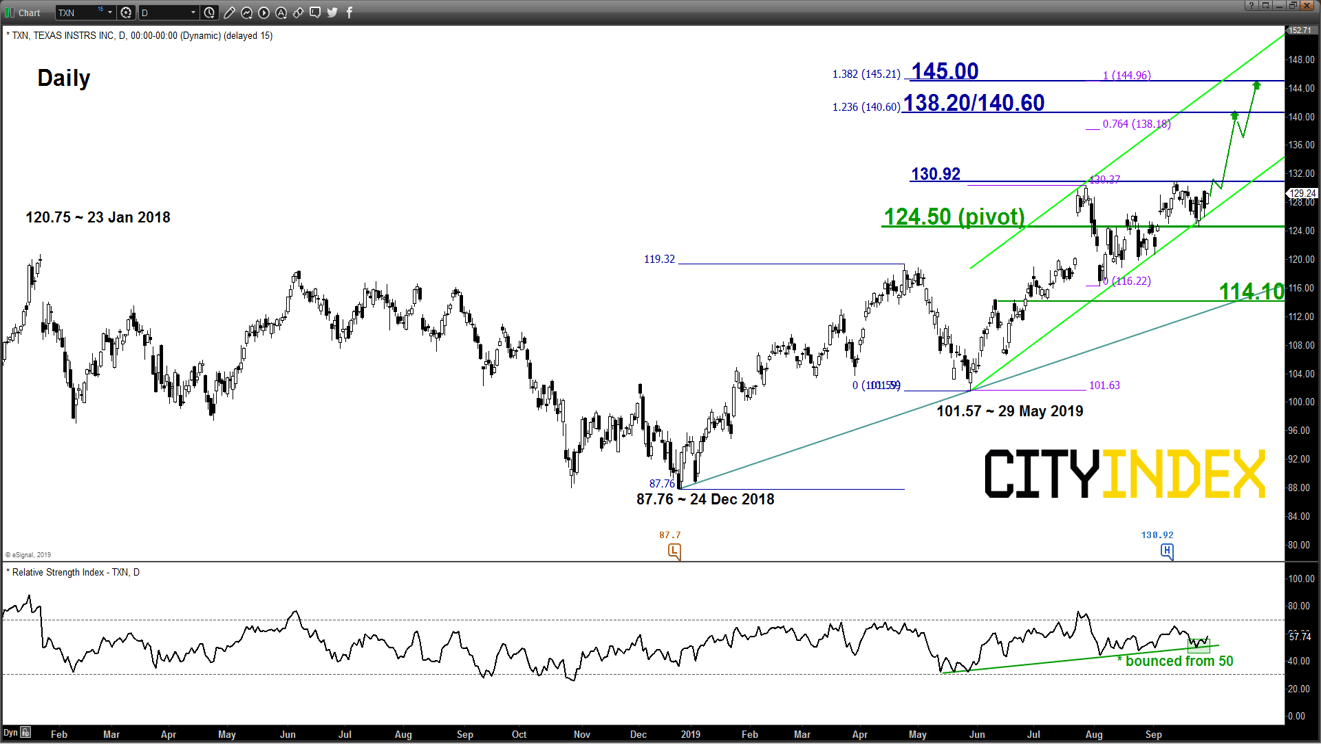
Pivot (key support): 124.50
Resistances: 130.92, 138.20/140.60 & 145.00
Next support: 114.10
Directional Bias (1 to 3 weeks)
Texas Instruments, a diversified semiconductor firm that supplies to a broad range of industries from automakers, telecommunications to consumer electronics and it is also the 2nd biggest weightage component stock in the PHLX Semiconductor Sector Index.
Its share price is now exhibiting positive technical elements where it may surge above its current all-time high level of 130.92 printed on 12 Sep 2019. Bullish bias above the 124.50 key medium-term pivotal support for a further potential up move to target the next resistance at 138.20/140.60 and a clearance above 140.60 sees a further rally towards 145.00 next.
On the other hand, a break with a daily close below 124.50 invalidates the impulsive up move scenario for a corrective decline to test a major support at 114.10 (also the ascending trendline from 24 Dec 2018 low).
Key elements
- TXN has continued to evolve within a medium-term ascending channel in place since 29 May 2019 with the lower boundary of the ascending channel acting a support at 124.50.
- The upper boundary of the aforementioned ascending channel stands at 145.00 which is also defined by a Fibonacci expansion cluster.
- The daily RSI oscillator has managed to stage a rebound from a corresponding ascending support in place since 29 May 2019 low and the 50 level. This observation suggests a revival of medium-term upside momentum.
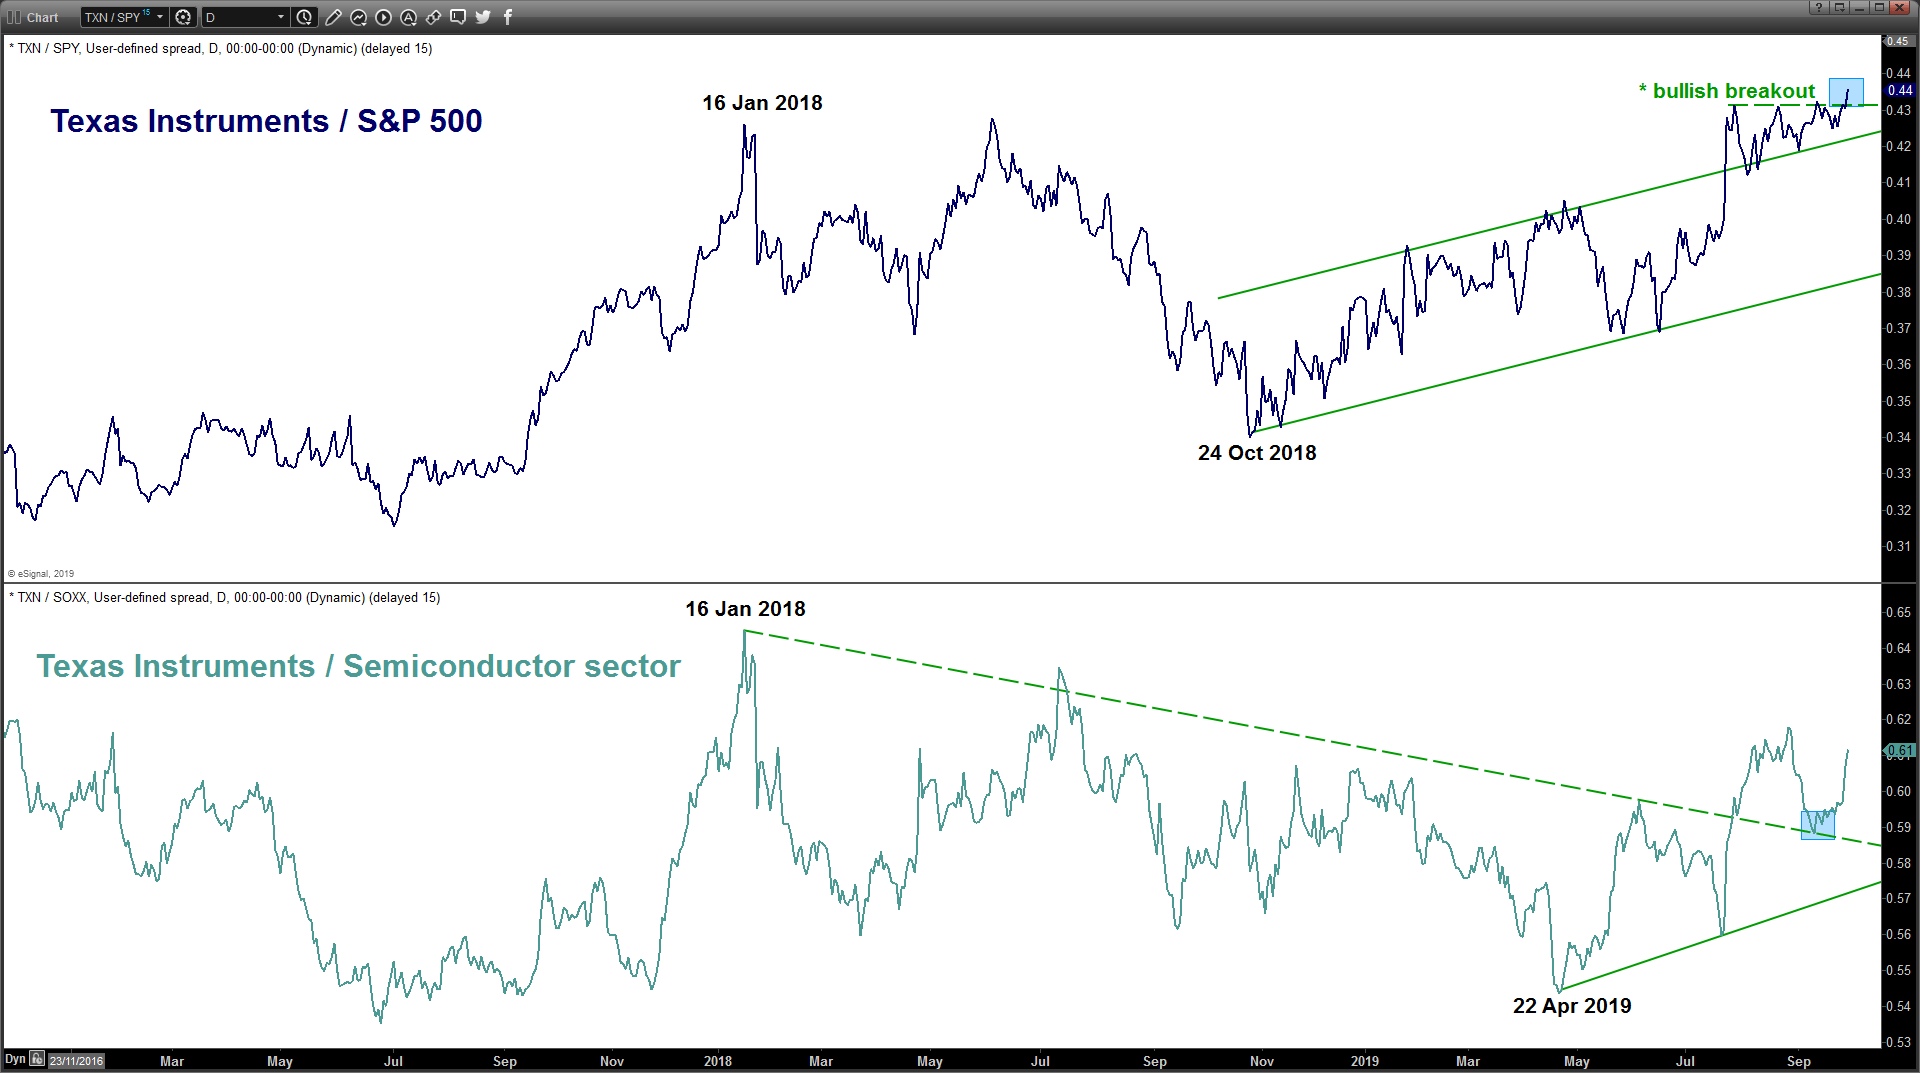
- Relative strength analysis against the market (S&P 500) and its sector (Semiconductor) from the respective ratio charts are suggesting further potential outperformance of TXN.
Charts are from eSignal
StoneX Financial Ltd (trading as “City Index”) is an execution-only service provider. This material, whether or not it states any opinions, is for general information purposes only and it does not take into account your personal circumstances or objectives. This material has been prepared using the thoughts and opinions of the author and these may change. However, City Index does not plan to provide further updates to any material once published and it is not under any obligation to keep this material up to date. This material is short term in nature and may only relate to facts and circumstances existing at a specific time or day. Nothing in this material is (or should be considered to be) financial, investment, legal, tax or other advice and no reliance should be placed on it.
No opinion given in this material constitutes a recommendation by City Index or the author that any particular investment, security, transaction or investment strategy is suitable for any specific person. The material has not been prepared in accordance with legal requirements designed to promote the independence of investment research. Although City Index is not specifically prevented from dealing before providing this material, City Index does not seek to take advantage of the material prior to its dissemination. This material is not intended for distribution to, or use by, any person in any country or jurisdiction where such distribution or use would be contrary to local law or regulation.
For further details see our full non-independent research disclaimer and quarterly summary.
CFDs are complex instruments and come with a high risk of losing money rapidly due to leverage. 69% of retail investor accounts lose money when trading CFDs with this provider. You should consider whether you understand how CFDs work and whether you can afford to take the high risk of losing your money. CFD and Forex Trading are leveraged products and your capital is at risk. They may not be suitable for everyone. Please ensure you fully understand the risks involved by reading our full risk warning.
City Index is a trading name of StoneX Financial Ltd. Head and Registered Office: 1st Floor, Moor House, 120 London Wall, London, EC2Y 5ET. StoneX Financial Ltd is a company registered in England and Wales, number: 05616586. Authorised and regulated by the Financial Conduct Authority. FCA Register Number: 446717.
City Index is a trademark of StoneX Financial Ltd.
The information on this website is not targeted at the general public of any particular country. It is not intended for distribution to residents in any country where such distribution or use would contravene any local law or regulatory requirement.
© City Index 2024