Tesco shares slide on inflation and margin worries
Like clockwork, Tesco’s group operating profit comes in moderately above £1.2bn guidance, as CEO Dave Lewis suggested it would.
Tesco on Target
And the rest of this set of results is, largely, on the side of being more than satisfactory too.
The group operating margin is on target at 2.3% and Tesco’s statement suggests that scope is now emerging to hit the 3.5%-4% 2020 margin goal a little earlier. We think it’s also unlikely that investors will look askance at the retail operating cash flow growth of 9% to 2.3bn, or that the group is only somewhat under a quarter of the way to achieving its ‘medium-term’ cost savings target of £1.5bn.
Together with a near elimination of shop floor inefficiencies like availability, and further inroads in range simplification and ‘promotional participation’ down by a third, Tesco has safely retained the impression of having entered an era of being a much more tightly run ship, whose nimble and reactive use of data has quietly become the industry standard, again.
International price war
Niggles are of course inevitable in an environment that the group highlights as “highly competitive” and the intensity of that competition knows no borders, notes Tesco. It is linking a 12.5% operating profit decline at constant exchange rates in the international division to “intense competition” in Poland, where the group was forced to double down efforts to invest in price, hitting Central Europe profits.
The group also offers no relief for the outlook with respect to a retail tax in Poland (suspended pending an EC investigation) having flagged the issue earlier in the year. Tesco’s cover-all caution about “legislative changes” in its European markets is reiterated in its preliminary full-year report, which is direct enough guidance to expect the Central region in particular and perhaps International in general to remain a drag at least into the second half of its financial year.
Fewer discounts more price “investments”
Closer to home, there’s also no let-up in Britain’s uniquely taxing grocery sector, and although the effectiveness of efforts by UK/Ireland management to regain the initiative speak for themselves, it’s difficult to see the group pulling faster and more decisively ahead in the current financial year. In particular, we wonder how much of the 6% fall in typical basket price since 2014 relates to momentum of previous price initiatives.
And whilst laudable, the strategy of eschewing short-term discount hits in favour of focusing “investments on sustainable improvements” is at odds with the almost real-time competitive opportunism of Britain’s grocery market and may leave the group exposed to at least marginal erosion of recently regained share.
Inflation by numbers
The impact of what Tesco describes as “inflation in a number of categories” therefore remains abstruse. This is one reason for the cautious shareholder reaction this morning to what is a solid set of annual results overall: Tesco has not quite struck a satisfactory tone on the outlook for inflation and the impact on consumer behaviour.
Beyond Booker
Wider investor misgivings are also emerging over the proposed Booker deal. Our own view on the move is unchanged—we are obliged to regard the deal as largely neutral. Returns on the table from the get go are likely to be in the low single digits and projected synergies look ambitious. We do, however, think that disquiet is growing in the wider shareholder base over the increasingly acrimonious opposition to the deal, almost making accusations by institutional groups like Schroders that navigating the deal might be distracting, a self-fulfilling prophecy.
Beyond Booker, we think Tesco shares still express broader satisfaction with progress under CEO Dave Lewis, and we expect the repeated notice that dividends will be reinstated in the current year to go a long way towards recharging Tesco’s share price progress in the months to come, though Booker is not the group’s only hurdle on the horizon.
Margin erosion is coming to the fore across Tesco’s international footprint with a 30 basis point contraction in the first half of 2016/17 outside of UK/Ireland, accelerating to a 46 basis point erosion by the end of the group’s financial year. Underlying sales growth in International division was 1.3% for the year against 2.6% in H1.
That fall reflected a continuation of sharply competitive Eastern European conditions that the group cited in January and a short-lived sales decline in Thailand. In UK & Ireland, the return on investment margin fell to 67 basis points from 101 basis points in H1.
Suggestions by a handful of giant Tesco shareholders that the group should stick to its knitting will begin to carry more weight if this margin drift becomes a trend.
Lengthening shorts
All told, the shareholder spat over Booker and surprising, albeit mild, margin erosion have been seized on by shareholders as a reason to reduce even further, on Wednesday. In fact the stock was already underperforming rivals in the year to date (though up week-to-week) and is trading down 10.5% so far in 2017 as I write.
It’s worth noting that in common with other UK retail stocks in general and supermarket shares in particular, Tesco shares have seen a steady return of significant short trading activity this year. The FCA’s data, which covers short positions of at least 0.5% of the outstanding stock, shows Tesco shorts, at 3.59%, according to data for the week to 6th April. The high of 3.64% disclosed on 17th October 2016. Tesco shorts hit the highest level since the FCA began publishing its data (in 2012) in the week to 11th October 2016, at 3.64%.
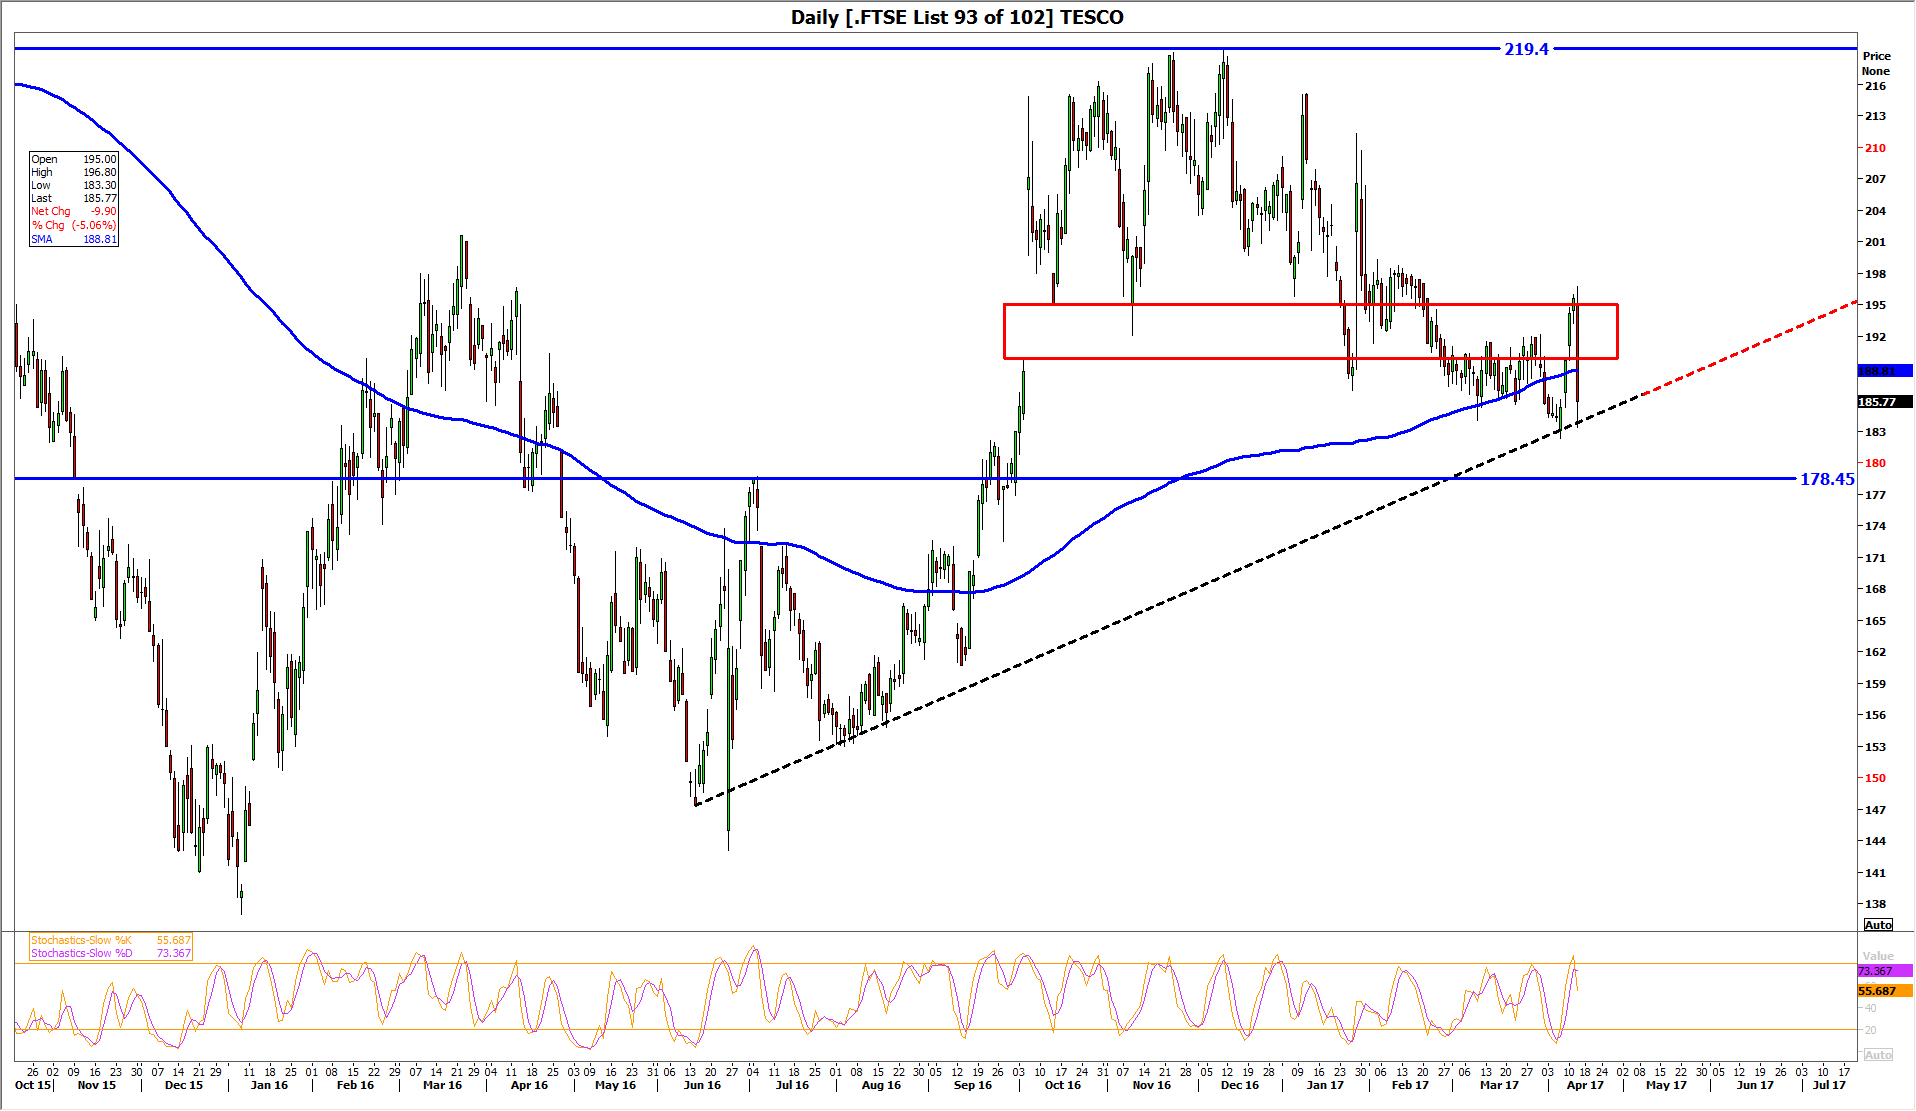
- On a technical basis, Tesco’s share price chart continues to suggest that the bears retain the upper hand
- We also have little reason to believe that an area where we have long suspected short orders to have accumulated is any less valid
- On our chart the region is highlighted by a red rectangle which had previously been a price gap that opened in October 2016 and was not filled completely until 25th January this year
- The latest attempt by TSCO to get through and above the region between last Thursday to date has failed with Wednesday’s sizeable drop
- That fall has also pierced the 200-day moving average (blue line); possibly reinstating the struggle the share has breaking sustainably above the threshold since 2014
- Whilst continuing to draw wide arcs from year to year though, the same long-term trend indicator does signal that price action is improving, given that it has been pointing higher since last August
- So long as Wednesday’s restive reaction by investors–in fact not just Wednesday’s, this year’s–phases out in the medium term, buyers targeting early December to late January highs between 200p-220p would not be making particularly punchy calls, in our view
- In the event of a sustained loss of tone under the 200-day MA and perhaps if the rising trend line from mid-June 2016 to date is broken, we would regard bears eyeing 178.5p support as a first target as more on the right track
DAILY CHART: TESCO PLC
Source: Thomson Reuters and City Index / please click image to enlarge
StoneX Financial Ltd (trading as “City Index”) is an execution-only service provider. This material, whether or not it states any opinions, is for general information purposes only and it does not take into account your personal circumstances or objectives. This material has been prepared using the thoughts and opinions of the author and these may change. However, City Index does not plan to provide further updates to any material once published and it is not under any obligation to keep this material up to date. This material is short term in nature and may only relate to facts and circumstances existing at a specific time or day. Nothing in this material is (or should be considered to be) financial, investment, legal, tax or other advice and no reliance should be placed on it.
No opinion given in this material constitutes a recommendation by City Index or the author that any particular investment, security, transaction or investment strategy is suitable for any specific person. The material has not been prepared in accordance with legal requirements designed to promote the independence of investment research. Although City Index is not specifically prevented from dealing before providing this material, City Index does not seek to take advantage of the material prior to its dissemination. This material is not intended for distribution to, or use by, any person in any country or jurisdiction where such distribution or use would be contrary to local law or regulation.
For further details see our full non-independent research disclaimer and quarterly summary.
CFDs are complex instruments and come with a high risk of losing money rapidly due to leverage. 69% of retail investor accounts lose money when trading CFDs with this provider. You should consider whether you understand how CFDs work and whether you can afford to take the high risk of losing your money. CFD and Forex Trading are leveraged products and your capital is at risk. They may not be suitable for everyone. Please ensure you fully understand the risks involved by reading our full risk warning.
City Index is a trading name of StoneX Financial Ltd. Head and Registered Office: 1st Floor, Moor House, 120 London Wall, London, EC2Y 5ET. StoneX Financial Ltd is a company registered in England and Wales, number: 05616586. Authorised and regulated by the Financial Conduct Authority. FCA Register Number: 446717.
City Index is a trademark of StoneX Financial Ltd.
The information on this website is not targeted at the general public of any particular country. It is not intended for distribution to residents in any country where such distribution or use would contravene any local law or regulatory requirement.
© City Index 2024