Tesco M and S shares set direction for the year
Sales updates may define their retail fortunes for the long term
Investors in Britain’s beleaguered retail sector often seem to over-react to good and bad news. The tendency was writ large on Thursday when erstwhile British institution Marks & Spencer and Britain’s biggest retailer, Tesco, reported third-quarter sales, including trade from the all-important Christmas season. Their results were mixed, but by no means surprising. Yet Tesco was rewarded with a share price jump that almost reached 3% for merely meeting expectations of a 0.1% like-for-like (LFL) sales rise over Christmas. Marks was punished a for growth drop at its struggling clothing & home division that was, admittedly, almost twice as bad as expected.
To be sure, the season had promising highlights and lowlights for both. M&S grocery sales could even be set to resume their remarkable run of outperformance in recent years. Its Q3 comparable food sales grew 1.4% on the year, above 1.1% expected. A big push of new ranges, and yes, lower prices, did the trick. Tesco’s weak quarter showed it struggled before the festive season. Investors were expecting a 0.5% rise on the year. They got +0.1%. As such, divergent share performance looks based as much on hopes that Tesco, the big UK retailer in the best financial repair, and with the best margins, can at least maintain market share, with profit projections intact. That’s despite continued reliance on its core UK & Ireland business for strength whilst weakness lingers in central Europe and the search for a way forward in Asia remains unresolved.
Simultaneously, fixing Marks’ homeware and clothing sales remains its best chance of a sustainable future, but the search for a winning formula continues to be tough. Getting the mix right in a way that shakes off CEO Steve Rowe’s put down that M&S styles are “too old” wasn’t achieved in Q3. There were signs that M&S stock buyers may have flipped too quickly to “too young”. The hope is that eventually, the right balance will be struck. But that’s also been the hope for a decade. M&S’s 25% share price drop in 2019 leaves the price down 53% over 5 years. There’s little reason to expect it to perk up in 2020.
Meanwhile, hopes of a high street boom after December’s Tory landslide unstuck Parliament’s Brexit logjam, didn’t really pan out at Christmas. For Amazon of course, business boomed as usual. Whilst M&S has farther to go to catch-up online than Tesco (Marks’ Ocado deal may help) online rivals continue to take a toll on both. In-store or on-screen, the final decider is the impact on margins. Marks & Spencer is expected to arrest a run of negative Ebitda margin results over the last three financial years in 2019/20. But core earnings margins are forecast to lapse below zero again in 2021/22. Tesco’s Ebitda margins, under departing turnaround CEO Dave Lewis, have been positive over that stretch though are forecast to slide this year. Still, they’ll remain positive. Perhaps investors aren’t over-reacting at all.
Chart points
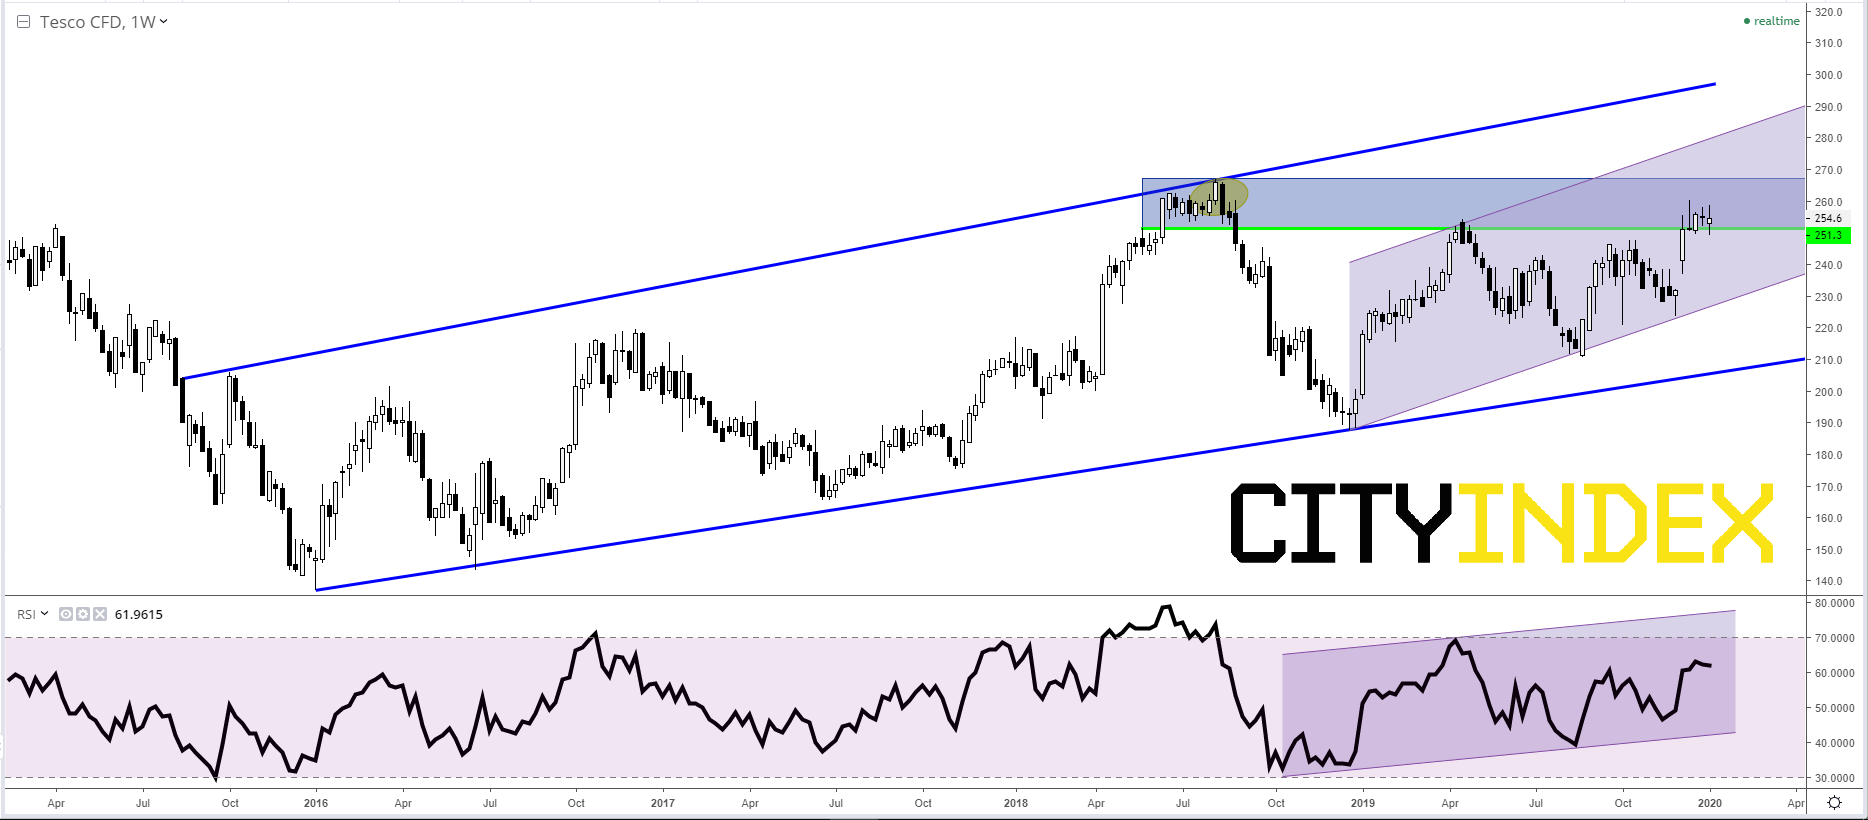
The slow, grinding recovery from all-time lows in 2016 appears to be on track, though 2020 could be the year that view is proved to be correct, or not. The upper line of a broad channel in place since September of the Brexit-vote year posed harsh resistance that ended TSCO’s bid to steepen gains two years later. Yet the lower rising line clearly supported the stock as it has trended higher again since hitting it early last year. However, the region between 2018’s 266.9p high in August 2018 and an intermediate top in May of that year at 251p is becoming a persistent challenge. TSCO’s 2019 254p peak, last April, was well within the zone. Right now, the stock could be faltering again, dipping temporarily below 251p this week, for the first time in 9 months. The weekly RSI has also turned lower. In theory, TSCO could manage a drop below 250p if the shorter-term channel beginning in December 2018 proves valid, with support around 228p-230p. A less comfortable test of longer-term rising support is a risk though, with 210p a possible decider. Above 251p-266p would strengthen chances that Tesco stock’s long road to recovery will continue this year.
Tesco Plc. CFD – Weekly
Source: City Index
StoneX Financial Ltd (trading as “City Index”) is an execution-only service provider. This material, whether or not it states any opinions, is for general information purposes only and it does not take into account your personal circumstances or objectives. This material has been prepared using the thoughts and opinions of the author and these may change. However, City Index does not plan to provide further updates to any material once published and it is not under any obligation to keep this material up to date. This material is short term in nature and may only relate to facts and circumstances existing at a specific time or day. Nothing in this material is (or should be considered to be) financial, investment, legal, tax or other advice and no reliance should be placed on it.
No opinion given in this material constitutes a recommendation by City Index or the author that any particular investment, security, transaction or investment strategy is suitable for any specific person. The material has not been prepared in accordance with legal requirements designed to promote the independence of investment research. Although City Index is not specifically prevented from dealing before providing this material, City Index does not seek to take advantage of the material prior to its dissemination. This material is not intended for distribution to, or use by, any person in any country or jurisdiction where such distribution or use would be contrary to local law or regulation.
For further details see our full non-independent research disclaimer and quarterly summary.
CFDs are complex instruments and come with a high risk of losing money rapidly due to leverage. 69% of retail investor accounts lose money when trading CFDs with this provider. You should consider whether you understand how CFDs work and whether you can afford to take the high risk of losing your money. CFD and Forex Trading are leveraged products and your capital is at risk. They may not be suitable for everyone. Please ensure you fully understand the risks involved by reading our full risk warning.
City Index is a trading name of StoneX Financial Ltd. Head and Registered Office: 1st Floor, Moor House, 120 London Wall, London, EC2Y 5ET. StoneX Financial Ltd is a company registered in England and Wales, number: 05616586. Authorised and regulated by the Financial Conduct Authority. FCA Register Number: 446717.
City Index is a trademark of StoneX Financial Ltd.
The information on this website is not targeted at the general public of any particular country. It is not intended for distribution to residents in any country where such distribution or use would contravene any local law or regulatory requirement.
© City Index 2024