Tepid share price rises are a US Black Friday Tradition
The most important piece of Black Friday wisdom smart U.S. investors could pass on to newer participants around the world? Don’t expect much benefit for stocks immediately after, and keep an eye on the bigger picture.
To be sure, retailers typically proffer early assessments of Black Friday/Cyber Monday performance in late trading on the second day, and if sales have boomed, the whole market can rise.
It works both ways though. And later, the market sometimes over-corrects in the opposite direction.
The most infamous example was in November and December 2008, though other factors were at play then, and the Dow Jones Industrial average put in a shallow rally of almost 8% in December into the year end.
The trend reversal pattern is quite clear and consistent though.
Each year since the 1930s where the two-day trend was lower, DJIA drifted higher until the New Year by about 2% on average.
The gain tends to be only slightly less when stocks rise on the two days after Thanksgiving.
Admittedly, as investment tips go, preparing for a 2% reversal after Thanksgiving is one most investors can afford not to know.
A better statistically backed bet is that U.S. stocks will, by the end of December’s first week, rise compared to the Monday on Thanksgiving week.
That pattern has been true for two thirds of the time over 100 years. For the rest of the year, stats say the odds of a rise are just a bit better than 50/50.
This also backs broader data that show 1) markets rise in the two days before all exchange holidays and 2) markets are usually higher at month end.
However, don’t forget the one-out-of-three chance of a fall by every second Friday after Thanksgiving.
Will this weekend be a ‘one-in-three’ for U.S. investors and retailers?
The U.S. Retail Federation doesn’t thinks so. It sees a 3.6% rise in November and December from last year to $655.8bn.
Retailers need the boost. The sector has struggled this year against the inexorable shift to online shopping.
Established names like Toys “R” Us, J Crew and Neiman Marcus have seen creditors demand higher yields over the last 18 months.
Average bids for retail debt in the secondary market are down 3.5 basis points over that time and 3.64 basis points under the broader loans market.
Trump uncertainty coupled with risk that the rates environment could tighten faster than expected leave the U.S. retail sector looking like one of the more vulnerable next year.
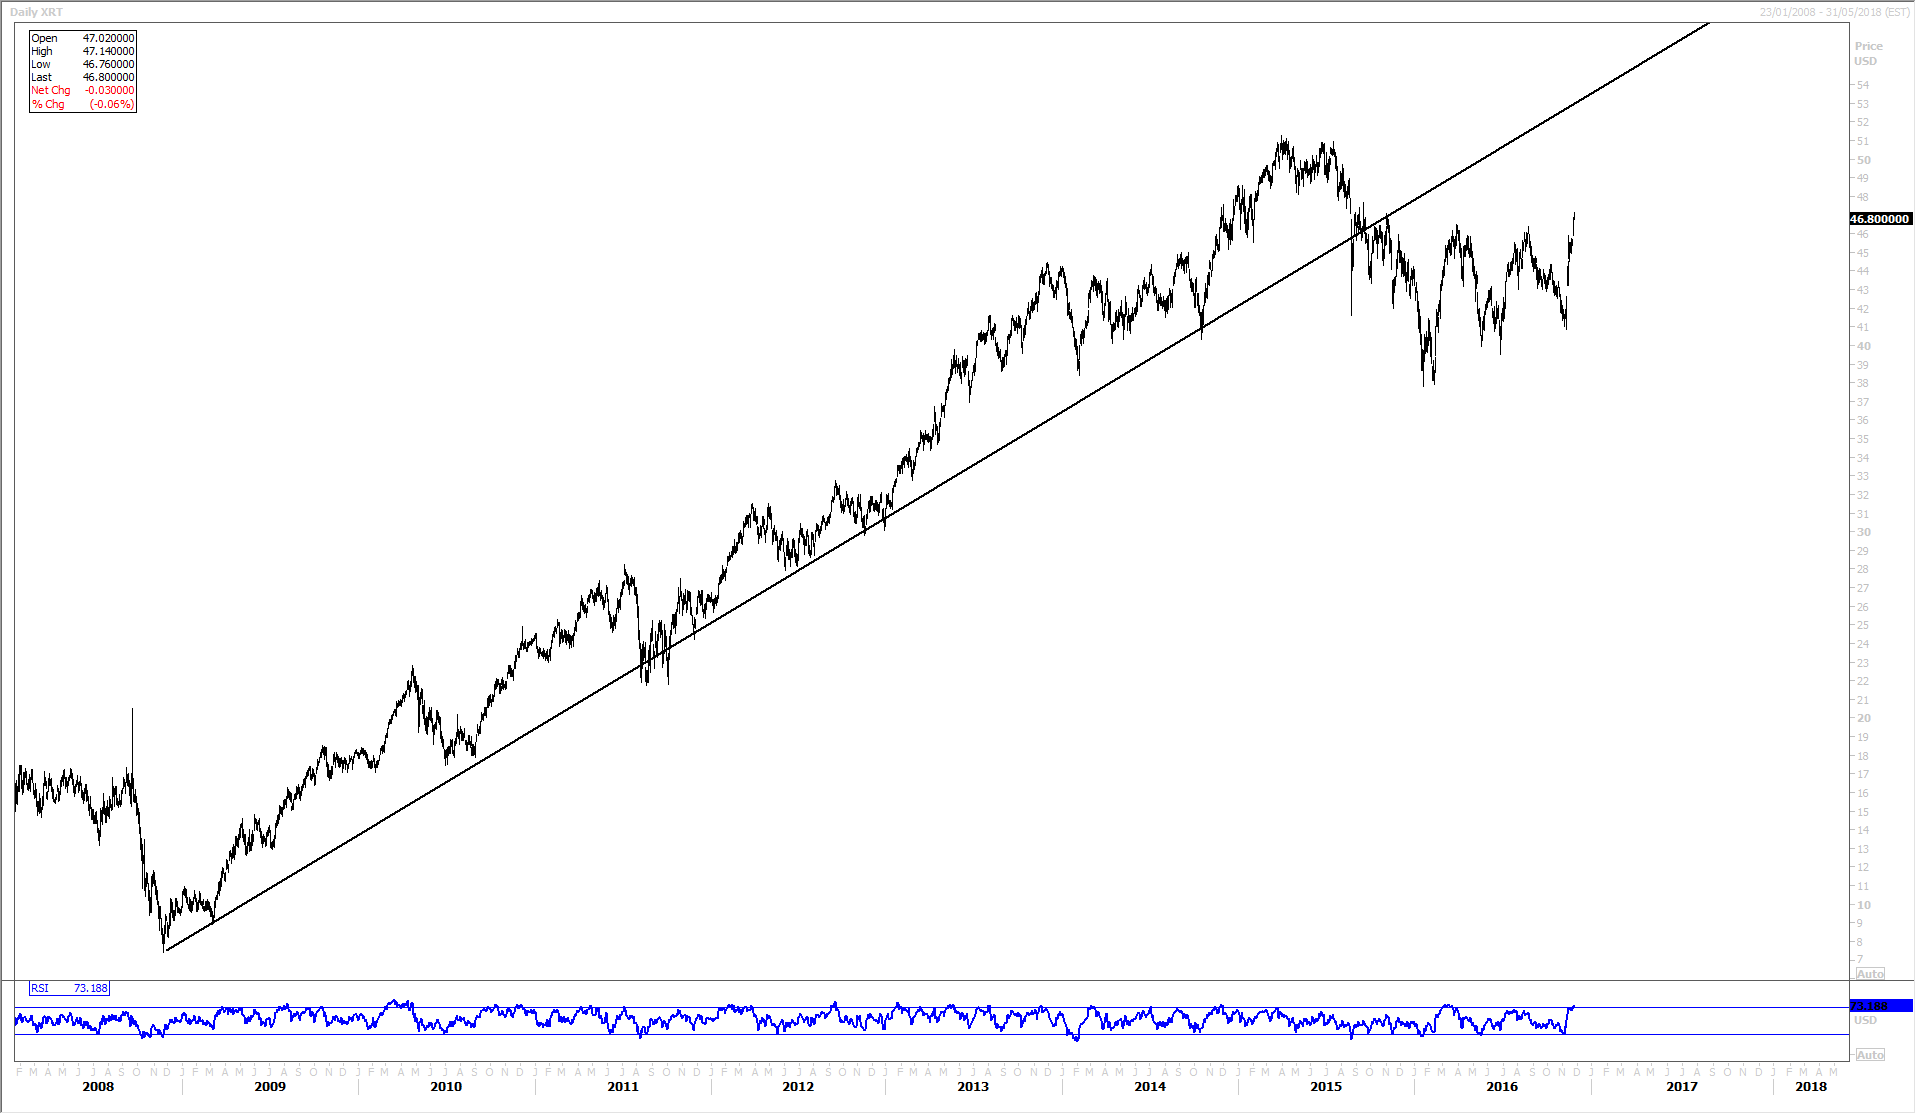
From a technical perspective it may be indicative of the outlook for the sector that a highly-liquid retail sector Exchange Traded Fund, the SPDR S&P Retail ETF (XRT) has had an erratic year during which it signally failed to break back above an ultra long-term trend.
DAILY CHART: SPDR S&P Retail ETF
Please click image to enlarge
The clear breach of the ETF’s advance since November 2008 is signalling that its investors do not expect as plain sailing for the retail shares as had been seen in the foregoing period.
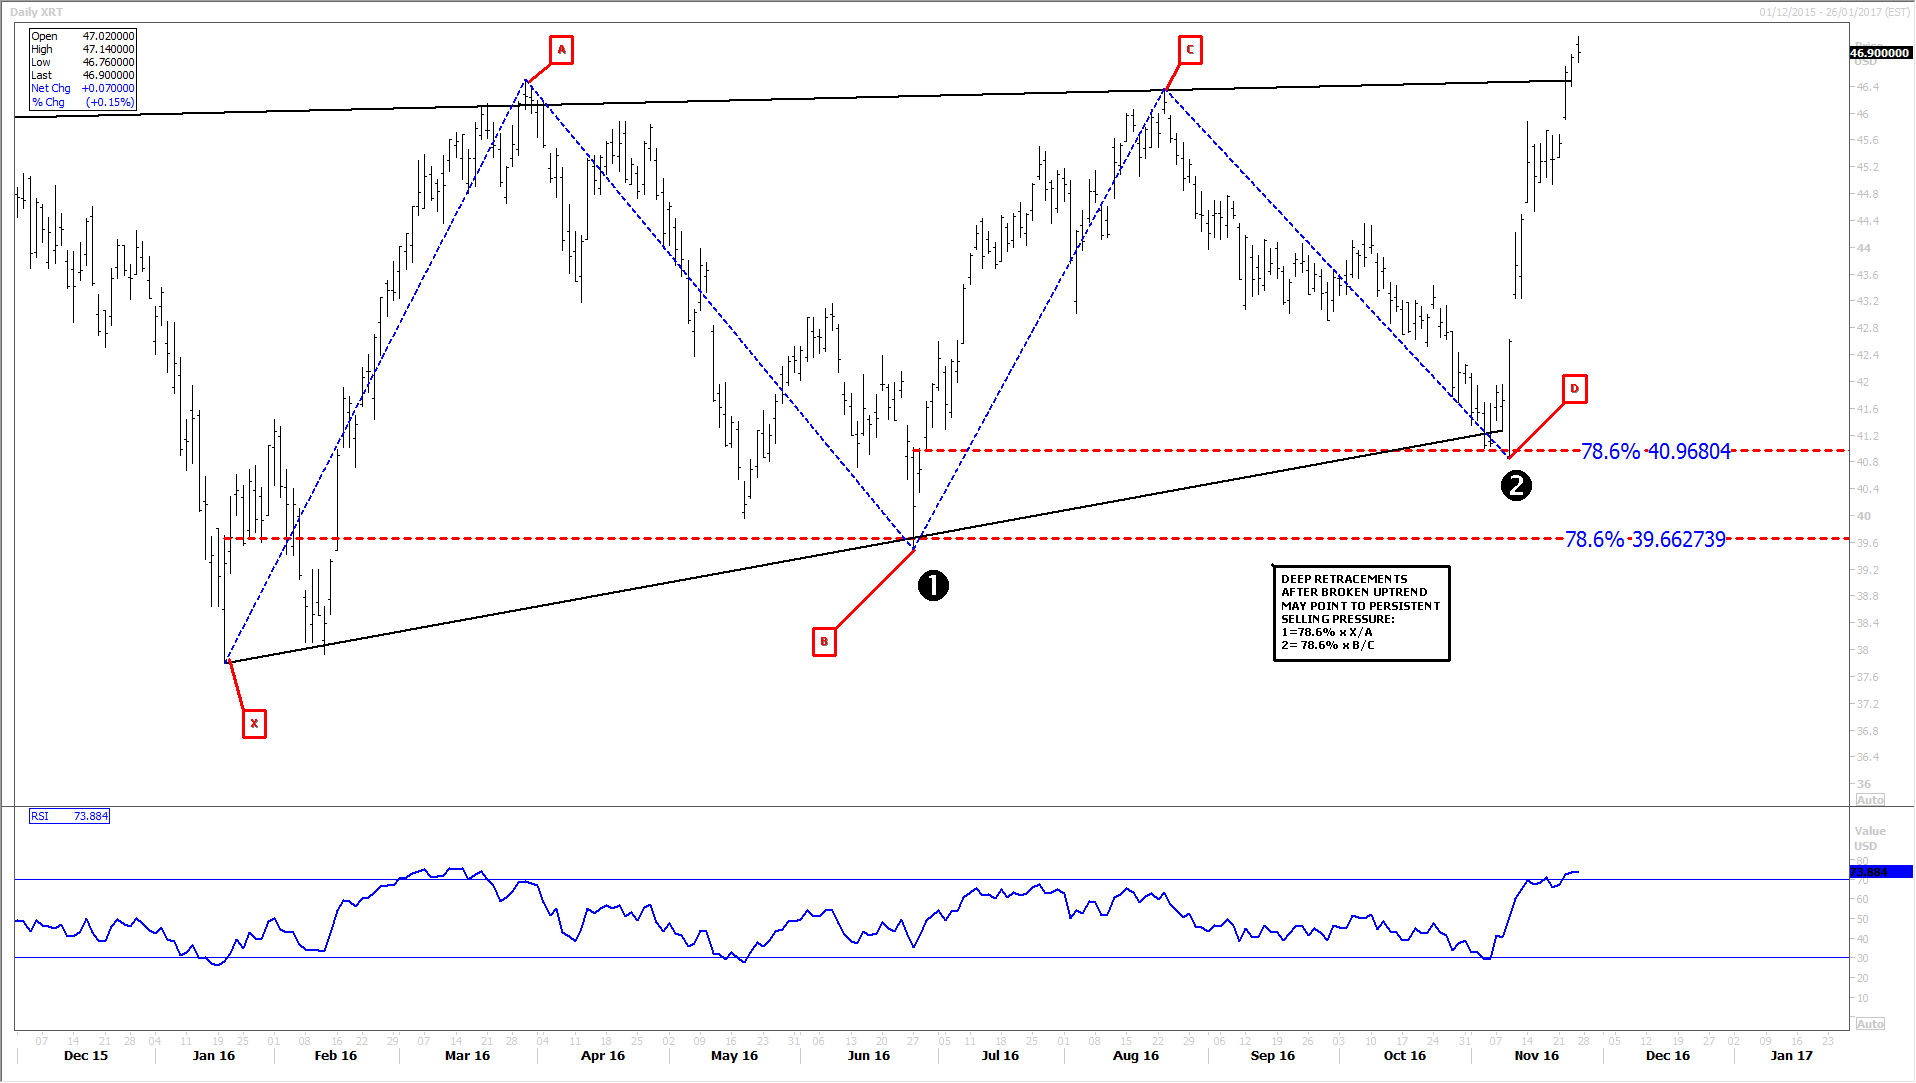
DAILY CHART: SPDR S&P Retail ETF
Please click image to enlarge
- A close up look shows XRT has twice attempted to reinstate its uptrend since the trend break and twice failed, at close to the same levels
- The asset subsequently staged deeper Fibonacci retracements than most chartists would regard as within theoretical norms that denote bullish market sentiment
- However, since both retracements were approximately 78.6%, improved symmetry kept the pattern of the price structure over the year symmetrical, a quality that tends to point to improved clarity of direction
- Given that XRT has over the last few days broken out of the convergent channel that has formed this year, the upside should prevail in the medium term
- However XRT still faces a daunting task to break back above the long-term rising line and its Relative Strength Index (RSI) momentum gauge is now travelling in the ‘overbought’ zone, indicating a correction is due
- The asset will almost certainly need another run-up in any attempt to regain the rising trend and on that basis, even if a moderate rise coinciding with the beginning of December is seen, XRT looks set to retreat soon
StoneX Financial Ltd (trading as “City Index”) is an execution-only service provider. This material, whether or not it states any opinions, is for general information purposes only and it does not take into account your personal circumstances or objectives. This material has been prepared using the thoughts and opinions of the author and these may change. However, City Index does not plan to provide further updates to any material once published and it is not under any obligation to keep this material up to date. This material is short term in nature and may only relate to facts and circumstances existing at a specific time or day. Nothing in this material is (or should be considered to be) financial, investment, legal, tax or other advice and no reliance should be placed on it.
No opinion given in this material constitutes a recommendation by City Index or the author that any particular investment, security, transaction or investment strategy is suitable for any specific person. The material has not been prepared in accordance with legal requirements designed to promote the independence of investment research. Although City Index is not specifically prevented from dealing before providing this material, City Index does not seek to take advantage of the material prior to its dissemination. This material is not intended for distribution to, or use by, any person in any country or jurisdiction where such distribution or use would be contrary to local law or regulation.
For further details see our full non-independent research disclaimer and quarterly summary.
CFDs are complex instruments and come with a high risk of losing money rapidly due to leverage. 69% of retail investor accounts lose money when trading CFDs with this provider. You should consider whether you understand how CFDs work and whether you can afford to take the high risk of losing your money. CFD and Forex Trading are leveraged products and your capital is at risk. They may not be suitable for everyone. Please ensure you fully understand the risks involved by reading our full risk warning.
City Index is a trading name of StoneX Financial Ltd. Head and Registered Office: 1st Floor, Moor House, 120 London Wall, London, EC2Y 5ET. StoneX Financial Ltd is a company registered in England and Wales, number: 05616586. Authorised and regulated by the Financial Conduct Authority. FCA Register Number: 446717.
City Index is a trademark of StoneX Financial Ltd.
The information on this website is not targeted at the general public of any particular country. It is not intended for distribution to residents in any country where such distribution or use would contravene any local law or regulatory requirement.
© City Index 2024