Tech giants shake off FTC funk but Facebook in focus
With the Nasdaq 100 set for its first weekly gain in five, leading U.S. tech shares are benefiting from the broadly improved mood across global stocks. That points to a more sanguine view than was shown by a knee-jerk retreat across tech stocks earlier in the week which had perceptibly more aversion than in the broader market.
Investors were reacting to reports of Federal Trade Commission and Justice Department probes into possible anti-competitive behaviour by dominant techs. The reports homed in on Alphabet-owned Google and Facebook. It’s one reason why shares in the search leader were still slightly negative on the week half way through Thursday’s session. Facebook stock was also sold hard in recent days before attracting enough buyers to stand 2.6% higher compared to the Nasdaq’s almost 4% weekly gain so far.
As well as a less pessimistic take on near-term tariff risks, it looks like investors are reassessing the ability of Washington prosecutors to land materially damaging blows to the dominant consumer web groups anytime soon. The quiet message from Facebook, Alphabet, Amazon and others is that they’ve been prepared for such a reckoning for months, if not years, and have plans to step up existing huge lobbying efforts together with formidable legal firepower.
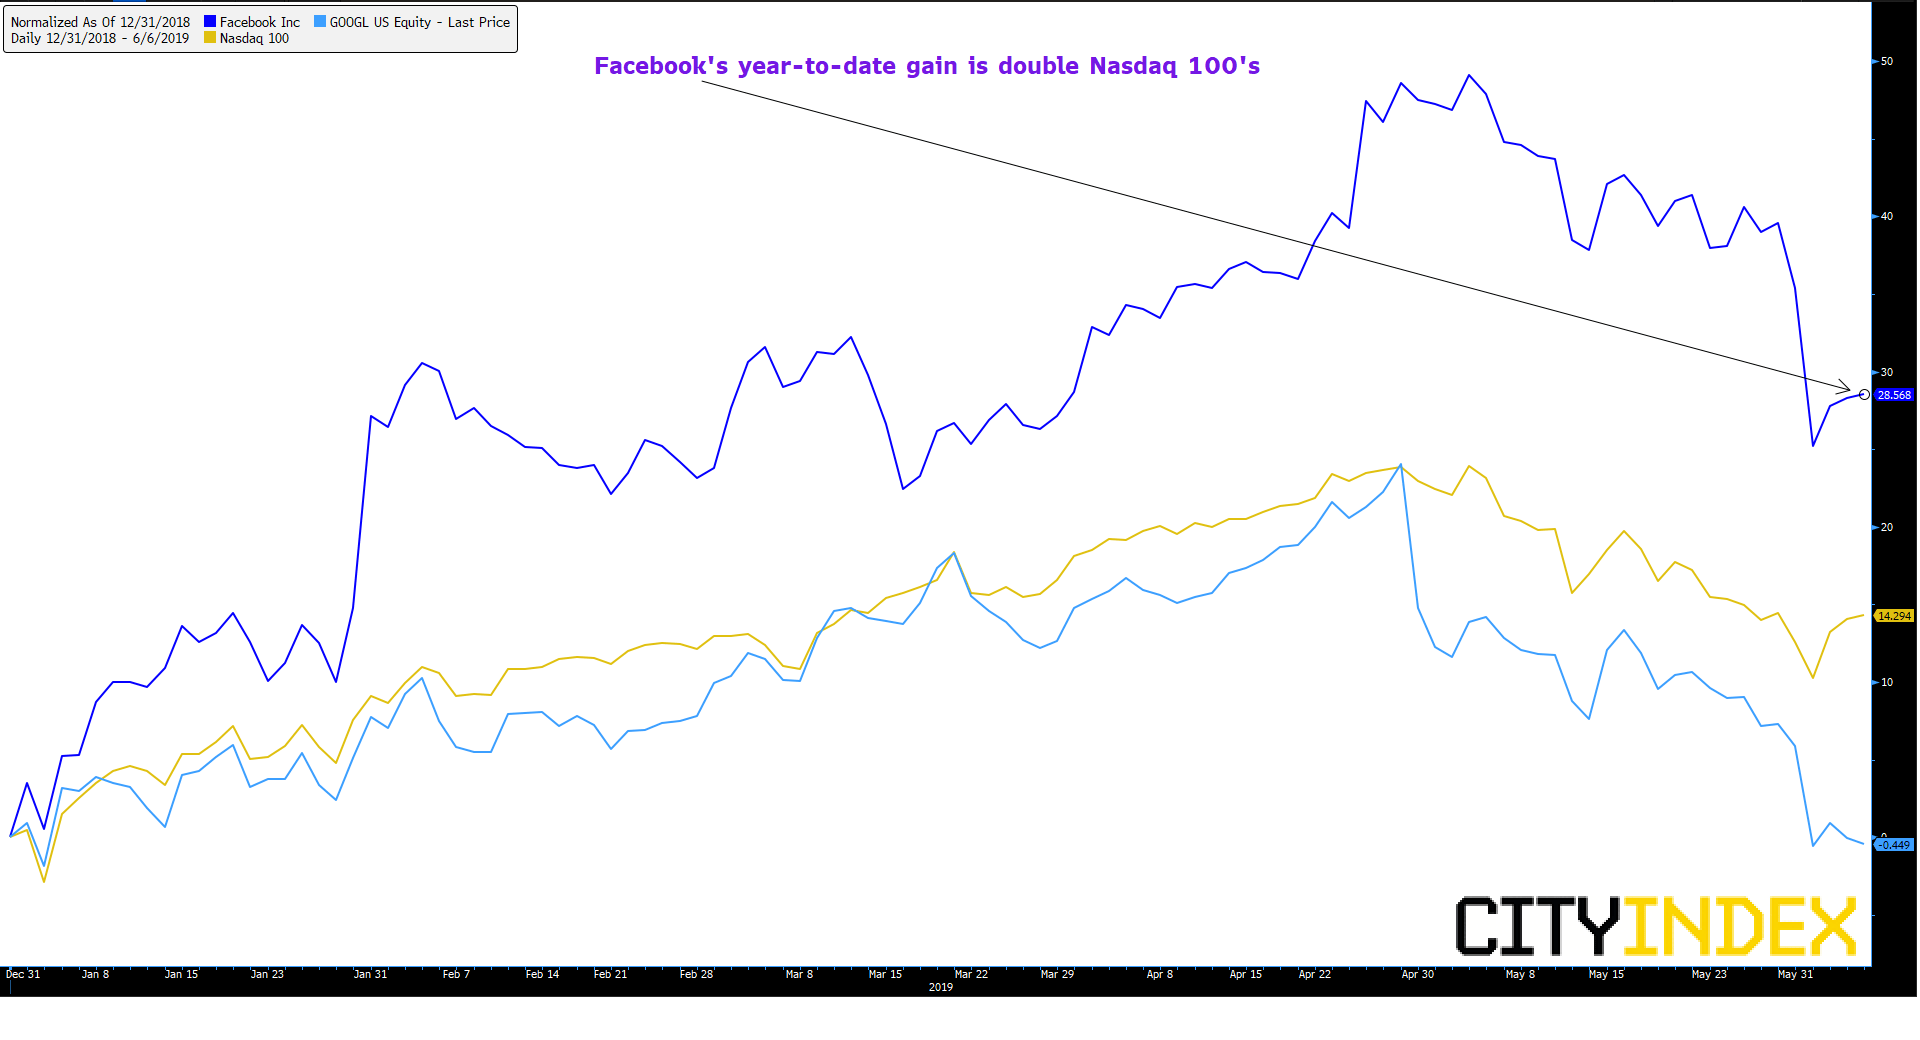
Even so, the tacit division of work shown by the unusual move towards a joint FTC-DoJ investigation shows a toughening line by regulators that underscores a lack of visibility about the outcome of any probes. And with Facebook’s price return for the year still double that of technology-focused Nasdaq 100, the group’s stock looks more exposed in the short term.
Normalised chart: Facebook Inc.; Alphabet Inc.; Nasdaq 100 – year to date
Source: Bloomberg/City Index
Facebook admits it will have to pay a fine of between $5bn-$3bn for failing to uphold privacy rules. As well, the European Union, Facebook’s biggest bugbear region, could soon order it to remove offensive posts in the EU and even hunt for similar posts anywhere in the world, according to an EU court opinion, published on Tuesday. Facebook is set to challenge the preliminary ruling. The full opinion will be published in a few month.
Chart thoughts
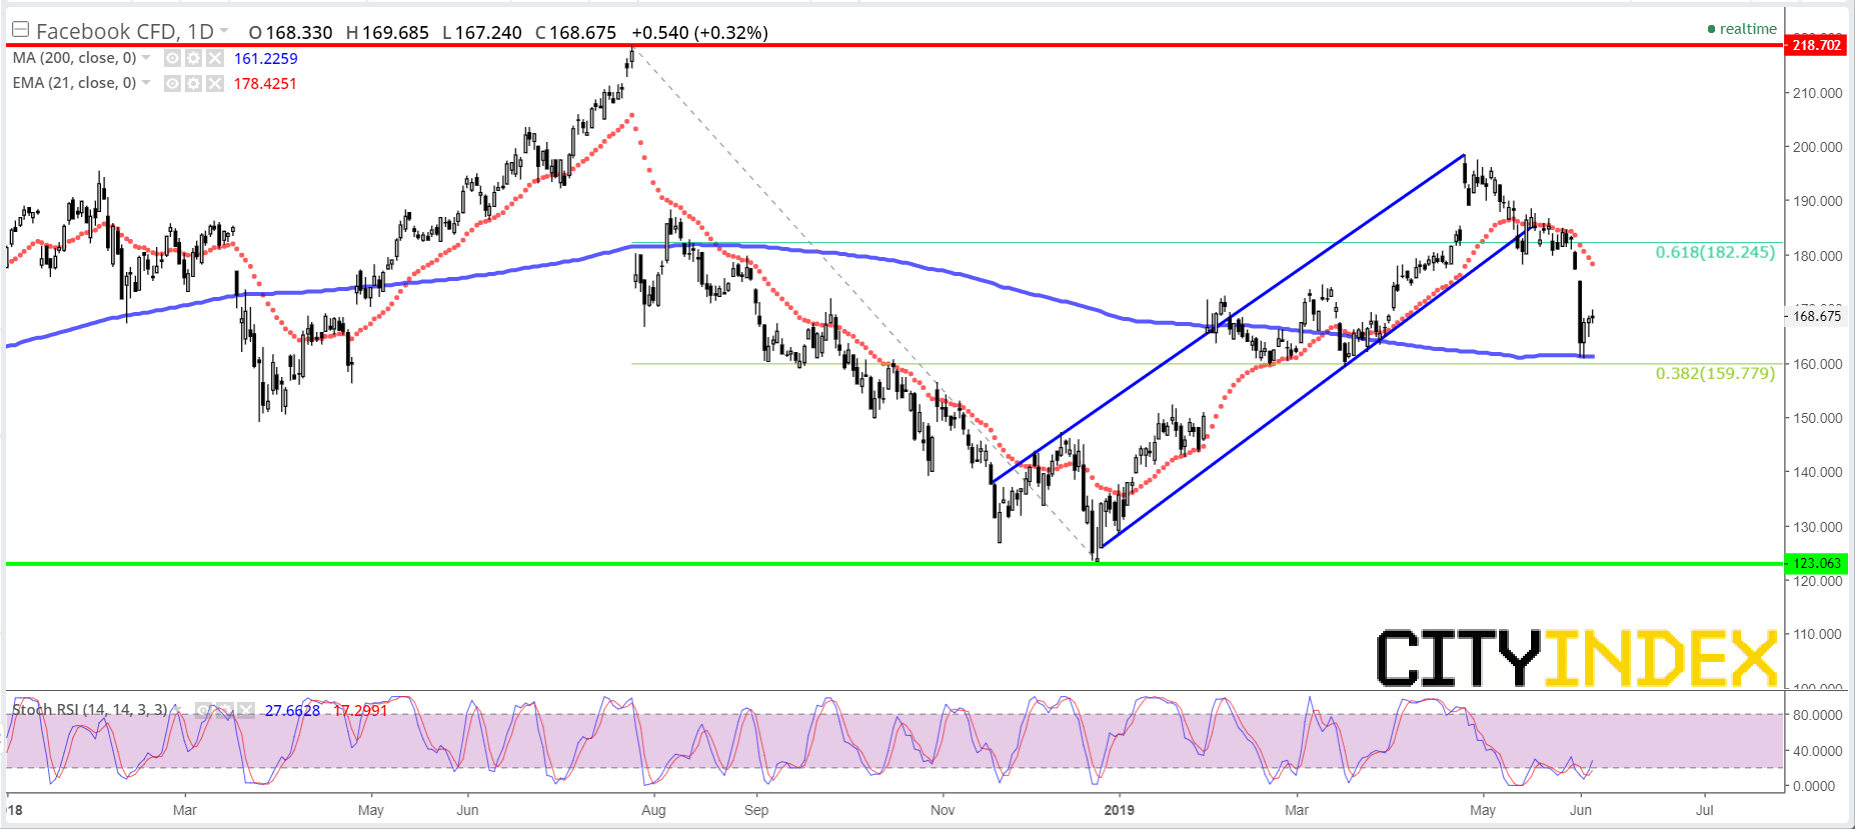
One interpretation of Facebook's technical price chart is seeing sellers and buyers as having battled for the upper hand for over a year. Buyers are currently, just, keeping the bias positive. But sellers are making strong in roads. The tussle is demonstrated by whippy gyrations across FB's preeminent trend barometer, the 200-day moving average (200-DMA), since at least early 2018. For now, the stock holds above that key threshold, as shown in the chart below. Yet a shorter-term and more contemporaneous trend gauge, the 21-day exponential moving average (21-DEMA) which is just as widely used as the 200-DMA, may carry greater predictive weight. The stock has lost support implied by trading above the 21-DEMA and the average itself tilts lower, showing objectively harder selling than buying over a three-week window.
What’s beautiful (and simple) about Facebook’s chart right now though is approximate respect of Fibonacci intervals. The recovery rally following last winter’s fierce correction faltered somewhat above 61.8% ($182) of the down move. And so far, the 38.2% marker ($160) has supported the stock in confluence with its 200-DMA. It’s clear the loss of these supports would represent Facebook shares crossing a threshold into a more bearish phase; one which could eye 21st December’s $123 low. Conversely, only a surefooted attack on $182 followed by a clean break above it would demonstrate the stock has put current challenges behind it.
Price chart: Facebook Inc CFD – daily [06/06/2019 20:05:35]
Source: City Index
StoneX Financial Ltd (trading as “City Index”) is an execution-only service provider. This material, whether or not it states any opinions, is for general information purposes only and it does not take into account your personal circumstances or objectives. This material has been prepared using the thoughts and opinions of the author and these may change. However, City Index does not plan to provide further updates to any material once published and it is not under any obligation to keep this material up to date. This material is short term in nature and may only relate to facts and circumstances existing at a specific time or day. Nothing in this material is (or should be considered to be) financial, investment, legal, tax or other advice and no reliance should be placed on it.
No opinion given in this material constitutes a recommendation by City Index or the author that any particular investment, security, transaction or investment strategy is suitable for any specific person. The material has not been prepared in accordance with legal requirements designed to promote the independence of investment research. Although City Index is not specifically prevented from dealing before providing this material, City Index does not seek to take advantage of the material prior to its dissemination. This material is not intended for distribution to, or use by, any person in any country or jurisdiction where such distribution or use would be contrary to local law or regulation.
For further details see our full non-independent research disclaimer and quarterly summary.
CFDs are complex instruments and come with a high risk of losing money rapidly due to leverage. 69% of retail investor accounts lose money when trading CFDs with this provider. You should consider whether you understand how CFDs work and whether you can afford to take the high risk of losing your money. CFD and Forex Trading are leveraged products and your capital is at risk. They may not be suitable for everyone. Please ensure you fully understand the risks involved by reading our full risk warning.
City Index is a trading name of StoneX Financial Ltd. Head and Registered Office: 1st Floor, Moor House, 120 London Wall, London, EC2Y 5ET. StoneX Financial Ltd is a company registered in England and Wales, number: 05616586. Authorised and regulated by the Financial Conduct Authority. FCA Register Number: 446717.
City Index is a trademark of StoneX Financial Ltd.
The information on this website is not targeted at the general public of any particular country. It is not intended for distribution to residents in any country where such distribution or use would contravene any local law or regulatory requirement.
© City Index 2024