Take a break for AUD CAD
Want a break from the “Brexit” saga? You are not alone.
Today we are looking at the technical outlook of the AUD/CAD – in theory, this FX cross should be immune to the outcome of Britain’s EU referendum and the ever-changing opinion polls thereof.
There will however be some economic data from both Australia and Canada this week that may help move this pair: the RBA’s last policy meeting minutes on Tuesday and Canada’s monthly retail sales figures on Wednesday. With the Canadian dollar also having strong correlation with oil prices, Wednesday’s release of US oil inventories data may also have an influence on AUD/CAD’s direction.
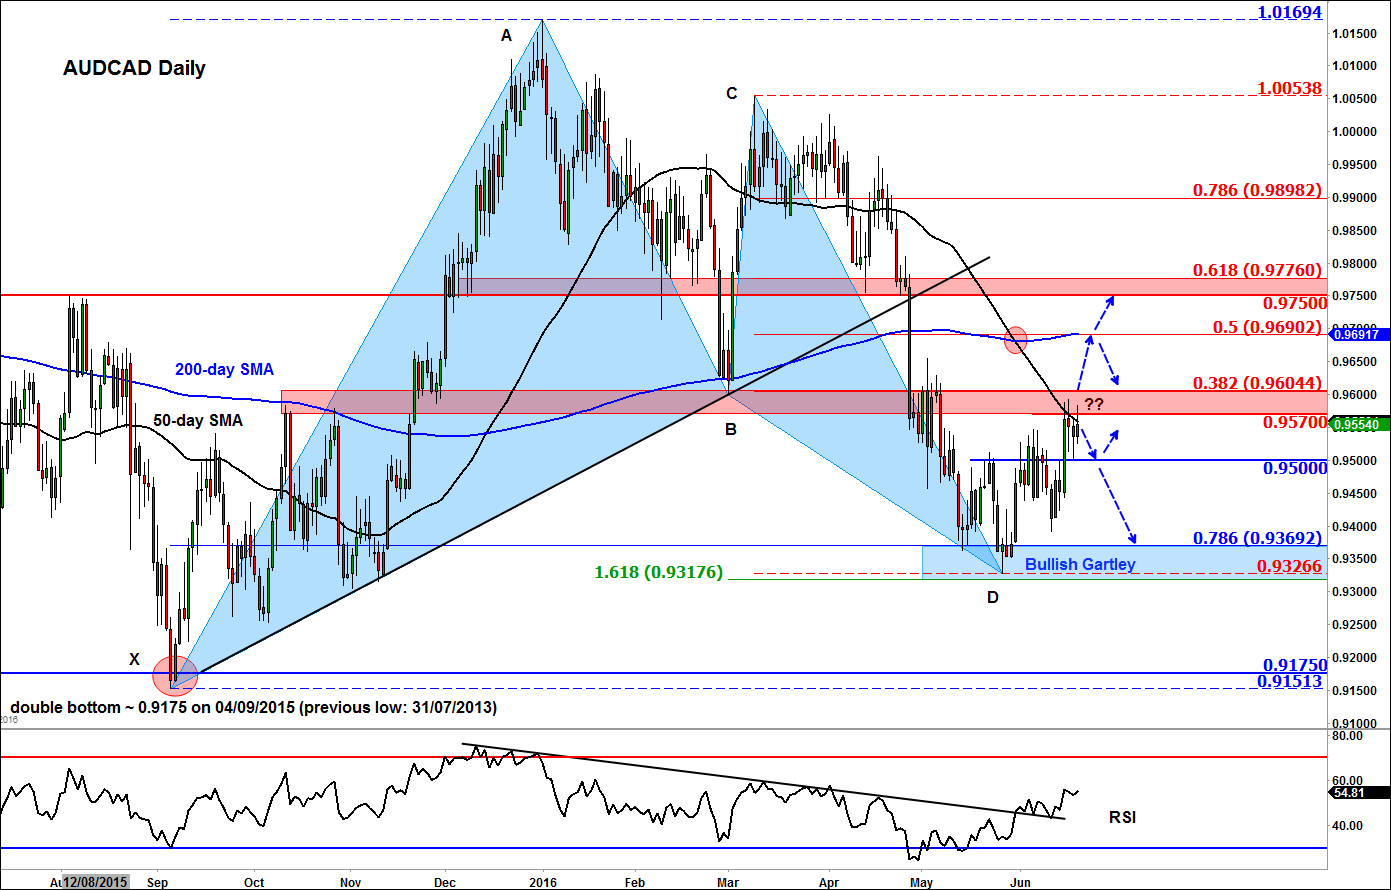
Turning our attention to the technical side of things and the AUD/CAD’s daily chart is trading around a key juncture near the pivotal 0.9570-0.9605 area, where the previous support-turned-resistance level meets the 50-day moving average and the 38.2% retracement of the most recent sell-off.
With the 50 and 200 day moving averages being in the “death crossover” order (50 < 200),="" and="" price="" residing="" below="" these="" averages,="" the="" trend="" is="" objectively="" bearish.="" on="" top="" of="" this,="" one="" can="" easily="" see="" that="" price="" has="" formed="" a="" lower="" low="" and="" a="" lower="" high,="">
However, the AUD/CAD’s double bottom pattern, formed in September of last year, around 0.9175, is still valid. What’s more, the AUD/CAD may have also formed point D of a Bullish Gartley pattern in recent weeks when it found support at the area between the 78.6% Fibonacci retracement of XA (0.9370) and 161.8% extension of the BC (0.9317) price swings. The bullish case is supported further by the RSI climbing above its own bearish trend line.
So, the battle is finely balanced, with both the bulls and bears having equally good arguments about the AUD/CAD’s next likely move. Traders can use this indecisiveness to their advantage by finding plenty of good trading opportunities near key support and resistance levels, such as those shown on the chart.
If the abovementioned resistance area around 0.9570-0.9605 breaks, the AUD/CAD may then move on to test the next bullish target at 0.9690, where the 200-day moving average meets the 50% retracement level. Thereafter, the next stop could well be at the 0.9750-0.9780 region, the convergence of the 61.8% Fibonacci level with previous support.
Conversely, if resistance around 0.9570-9605 holds, then a move down to at least 0.9500 or potentially even the Bullish Gartley area of around 0.9315-0.9370 could be the next stop.
StoneX Financial Ltd (trading as “City Index”) is an execution-only service provider. This material, whether or not it states any opinions, is for general information purposes only and it does not take into account your personal circumstances or objectives. This material has been prepared using the thoughts and opinions of the author and these may change. However, City Index does not plan to provide further updates to any material once published and it is not under any obligation to keep this material up to date. This material is short term in nature and may only relate to facts and circumstances existing at a specific time or day. Nothing in this material is (or should be considered to be) financial, investment, legal, tax or other advice and no reliance should be placed on it.
No opinion given in this material constitutes a recommendation by City Index or the author that any particular investment, security, transaction or investment strategy is suitable for any specific person. The material has not been prepared in accordance with legal requirements designed to promote the independence of investment research. Although City Index is not specifically prevented from dealing before providing this material, City Index does not seek to take advantage of the material prior to its dissemination. This material is not intended for distribution to, or use by, any person in any country or jurisdiction where such distribution or use would be contrary to local law or regulation.
For further details see our full non-independent research disclaimer and quarterly summary.
CFDs are complex instruments and come with a high risk of losing money rapidly due to leverage. 69% of retail investor accounts lose money when trading CFDs with this provider. You should consider whether you understand how CFDs work and whether you can afford to take the high risk of losing your money. CFD and Forex Trading are leveraged products and your capital is at risk. They may not be suitable for everyone. Please ensure you fully understand the risks involved by reading our full risk warning.
City Index is a trading name of StoneX Financial Ltd. Head and Registered Office: 1st Floor, Moor House, 120 London Wall, London, EC2Y 5ET. StoneX Financial Ltd is a company registered in England and Wales, number: 05616586. Authorised and regulated by the Financial Conduct Authority. FCA Register Number: 446717.
City Index is a trademark of StoneX Financial Ltd.
The information on this website is not targeted at the general public of any particular country. It is not intended for distribution to residents in any country where such distribution or use would contravene any local law or regulatory requirement.
© City Index 2024