Stocks rebound on PBoC as EZ deflation boosts ECB QE prospects
The European stock markets started the new week and the last day of February on the back foot this morning. The kick-back rally had actually fizzled at the end of last week when oil prices also retreated from their recent highs due in part to profit-taking, while at the weekend, the G20 meeting ended with few surprises. News that German retail sales grew by an above-forecast 0.7 per cent month-over-month in January was offset by data showing a sharp 1.5% drop in import prices. Then at 10:00 GMT this morning, stocks jumped on the back of news the People’s Bank of China (PBoC) has cut banks’ reserve requirement ratio by an additional 50 basis points. At the same time, fresh inflation data showed consumer prices in the Eurozone unexpectedly fell by 0.2% year-over-year in February, which raised the probability we may see the introduction of further monetary stimulus from ECB next month.
After a quick bounce, stocks quickly returned to their pre-PBoC levels, before stabilising. Traders are still digesting the news as we go to press. Clearly, central banks’ desire to depress yields and weaken their currencies further is still the policy of choice. This policy has repeatedly saved the stock markets over the years but with diminishing influence ever since the Fed ended QE. However with the Eurozone back in deflation and China struggling, the ECB may well expand its asset purchases programme noticeably come next Thursday. Leading up to the ECB meeting, traders have clearly been selling the EUR/USD, the pace of which accelerated on Friday when US inflation data surprised to the upside. If this week’s key US data show further improvement in the world’s largest economy then expectations about the path of rates between the Eurozone and the US will widen further, potentially leading to further falls in the EUR/USD. A weaker exchange rate would undoubtedly boost the appeal of European export names which can only be good news for the likes of the DAX and other European indices.
But on-going investor worries about deflation and other economic risks mean the potential gains for the markets may be limited unless we see a marked improvement in global data. Chief among them is worries over China. Given that the PBOC has made its move ahead of the publication of the latest manufacturing PMI data, some market participants may interpret this as a sign that the situation there may have deteriorated further. The good news is that we don’t have to wait a long time to find out if this is indeed the case – the PMI numbers are due for release in the early hours of Tuesday.
Traders will also be watching the oil market closely, with recent price action suggesting the worst of the selling may be behind us. If the oil market continues to stabilise then this could provide additional boost for stocks. But should oil prices come under renewed pressure now that they have had a decent bounce then this would bode ill for stocks.
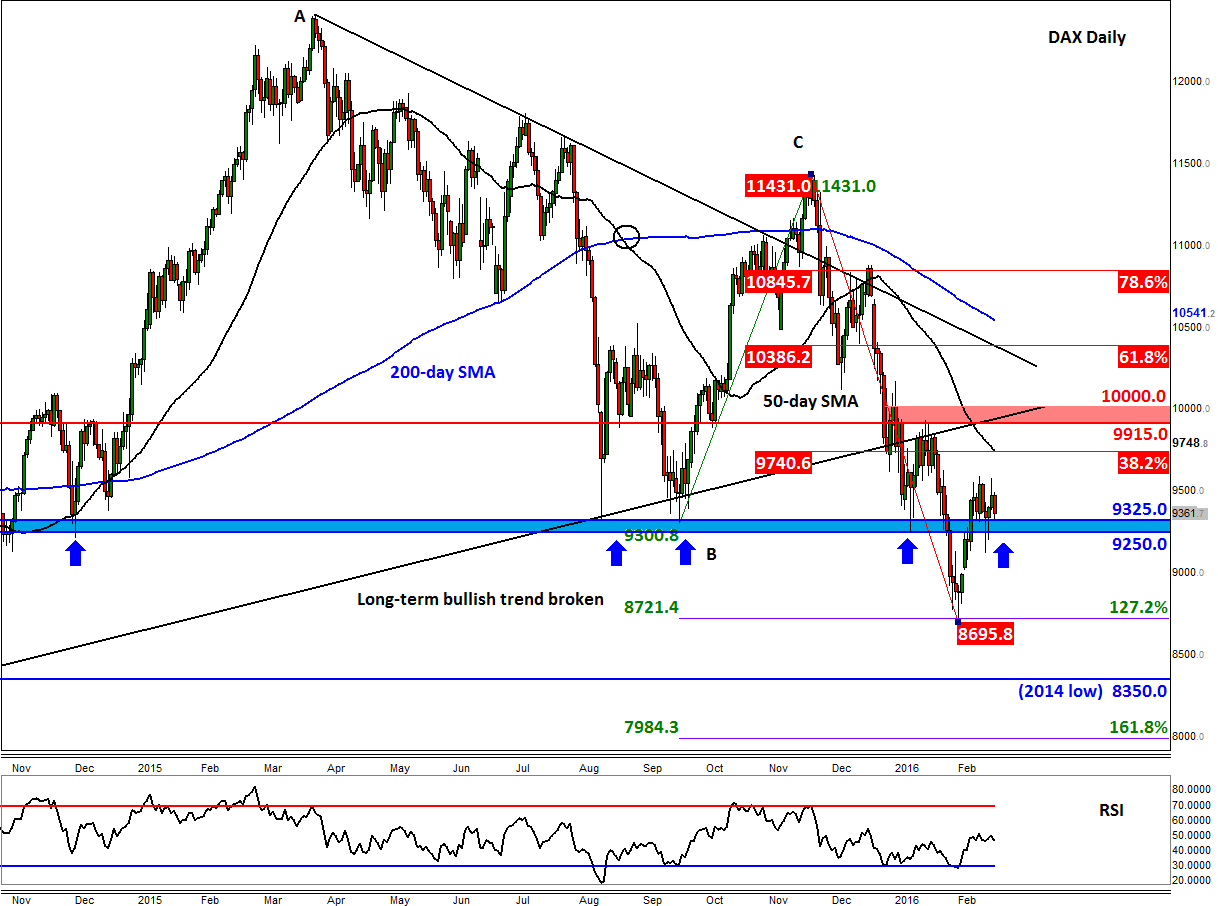
Technical outlook: DAX
The major stock indices have had a breather following the recent kick-back rally. Traders are wondering whether more gains can be seen going forward or now is the time for equities to resume their bearish trends. The German DAX index is among these indices to watch. As can be seen from the chart, below, it is finding decent support from the 92050-9325 range once again, like it had in the past. While it holds above here on a closing basis, the short-term technical outlook remains positive and we may see a more profound recovery in due course. But if the index takes out this area on a closing basis then all bets are off.
On the upside, the next bullish target to watch is 9740, which marks the meeting point of the 38.2% Fibonacci retracement level from the most recent drop with the 50-day moving average. Thereafter, traders should watch the backside of the long-term broken trend line which comes in somewhere between 9915 and 10000. But even if we get above this area, we would still not be out of the woods as there will be plenty of other potentially strong resistance levels to tackle including the 61.8% Fibonacci level and the bearish trend line. Until such a time it becomes clear that a bullish trend has been established, the bulls should remain nimble.
Indeed, if the 9250-9325 support range breaks down then there are not a lot of reference points to watch on the downside until the recent low at 8695 or the 2014 low at 8350. So, there is a danger for a sharp drop. But at the moment, it looks like the short-term trend is turning back to bullish. The bears should therefore wait for their opportunities as they have already enjoyed a big drop at the start of the year.
StoneX Financial Ltd (trading as “City Index”) is an execution-only service provider. This material, whether or not it states any opinions, is for general information purposes only and it does not take into account your personal circumstances or objectives. This material has been prepared using the thoughts and opinions of the author and these may change. However, City Index does not plan to provide further updates to any material once published and it is not under any obligation to keep this material up to date. This material is short term in nature and may only relate to facts and circumstances existing at a specific time or day. Nothing in this material is (or should be considered to be) financial, investment, legal, tax or other advice and no reliance should be placed on it.
No opinion given in this material constitutes a recommendation by City Index or the author that any particular investment, security, transaction or investment strategy is suitable for any specific person. The material has not been prepared in accordance with legal requirements designed to promote the independence of investment research. Although City Index is not specifically prevented from dealing before providing this material, City Index does not seek to take advantage of the material prior to its dissemination. This material is not intended for distribution to, or use by, any person in any country or jurisdiction where such distribution or use would be contrary to local law or regulation.
For further details see our full non-independent research disclaimer and quarterly summary.
CFDs are complex instruments and come with a high risk of losing money rapidly due to leverage. 69% of retail investor accounts lose money when trading CFDs with this provider. You should consider whether you understand how CFDs work and whether you can afford to take the high risk of losing your money. CFD and Forex Trading are leveraged products and your capital is at risk. They may not be suitable for everyone. Please ensure you fully understand the risks involved by reading our full risk warning.
City Index is a trading name of StoneX Financial Ltd. Head and Registered Office: 1st Floor, Moor House, 120 London Wall, London, EC2Y 5ET. StoneX Financial Ltd is a company registered in England and Wales, number: 05616586. Authorised and regulated by the Financial Conduct Authority. FCA Register Number: 446717.
City Index is a trademark of StoneX Financial Ltd.
The information on this website is not targeted at the general public of any particular country. It is not intended for distribution to residents in any country where such distribution or use would contravene any local law or regulatory requirement.
© City Index 2024