Stocks may have overacted to the downside on G20 news flow
Yesterday, 25 Jun “sell-off” seen in U.S. stocks have saw losses within the range of -1.00% to -1.5% among the key U.S. benchmark stock indices, the 3rd day of consecutive decline with the higher beta tech heavy Nasdaq 100 being hit the hardest.
Primary triggers have been negative news flow from “Fed Speak” and G20 as reported yesterday;
- Fed official Bullard was quoted in a media report that he favoured a 25 bps cut on the Fed funds rate to act as “an insurance” to buffer slower economic growth rather than a 50 bps reduction. This news flow triggered a negative feedback loop into the markets as the Fed funds futures have priced in a 42% probability of a 50 bps cut a day ago on 24 Jun based on CME Fed Watch tool.
- U.S. administration has stated that plans have been made to suspend the next round of tariffs on an additional US$300 billion of China imports ahead of G20 summit. Also, U.S. will not accept any further conditions on tariffs as part of reopening trade negations with China and no detailed trade deal is expected from the Trump-Xi G20 meeting as quoted by media from a senior U.S. administration official.
Media reports have attributed the sell-off seen in U.S stocks from the probable “less rosy” outcome from Trump-Xi G20 meeting where a trade deal will not be struck between U.S. and China. Interestingly, a week ago where media had interviewed the investing and political analysts’ community and most of them have a bias that a trade deal will not materialise after the G20 summit.
Thus, yesterday’s G20 related news have already been priced into the markets. In fact, the U.S. administration’s latest plan to delay additional tariffs on China imports has shown a “toned down hawkish stance” and the willingness to restart trade negotiation talks with China is rather a positive catalyst. Click here for a recap on our G20 preview.
Therefore, the 3-days of consecutive decline seen in stocks may have been overdone and since now the media has spin “a less rosy” outcome from Trump-Xi meeting and if any encouraging trade related remarks from U.S. administration after the meeting can easily trigger a positive feedback loop back into stocks and risk assets.
Now, lets us review the technical structure on the Hang Seng Index, a key China related play that can be impacted from G20 news flows.
Short-term technical outlook on Hang Seng Index/Hong Kong 50 (Wed 26 Jun)
click to enlarge charts
Key technical elements
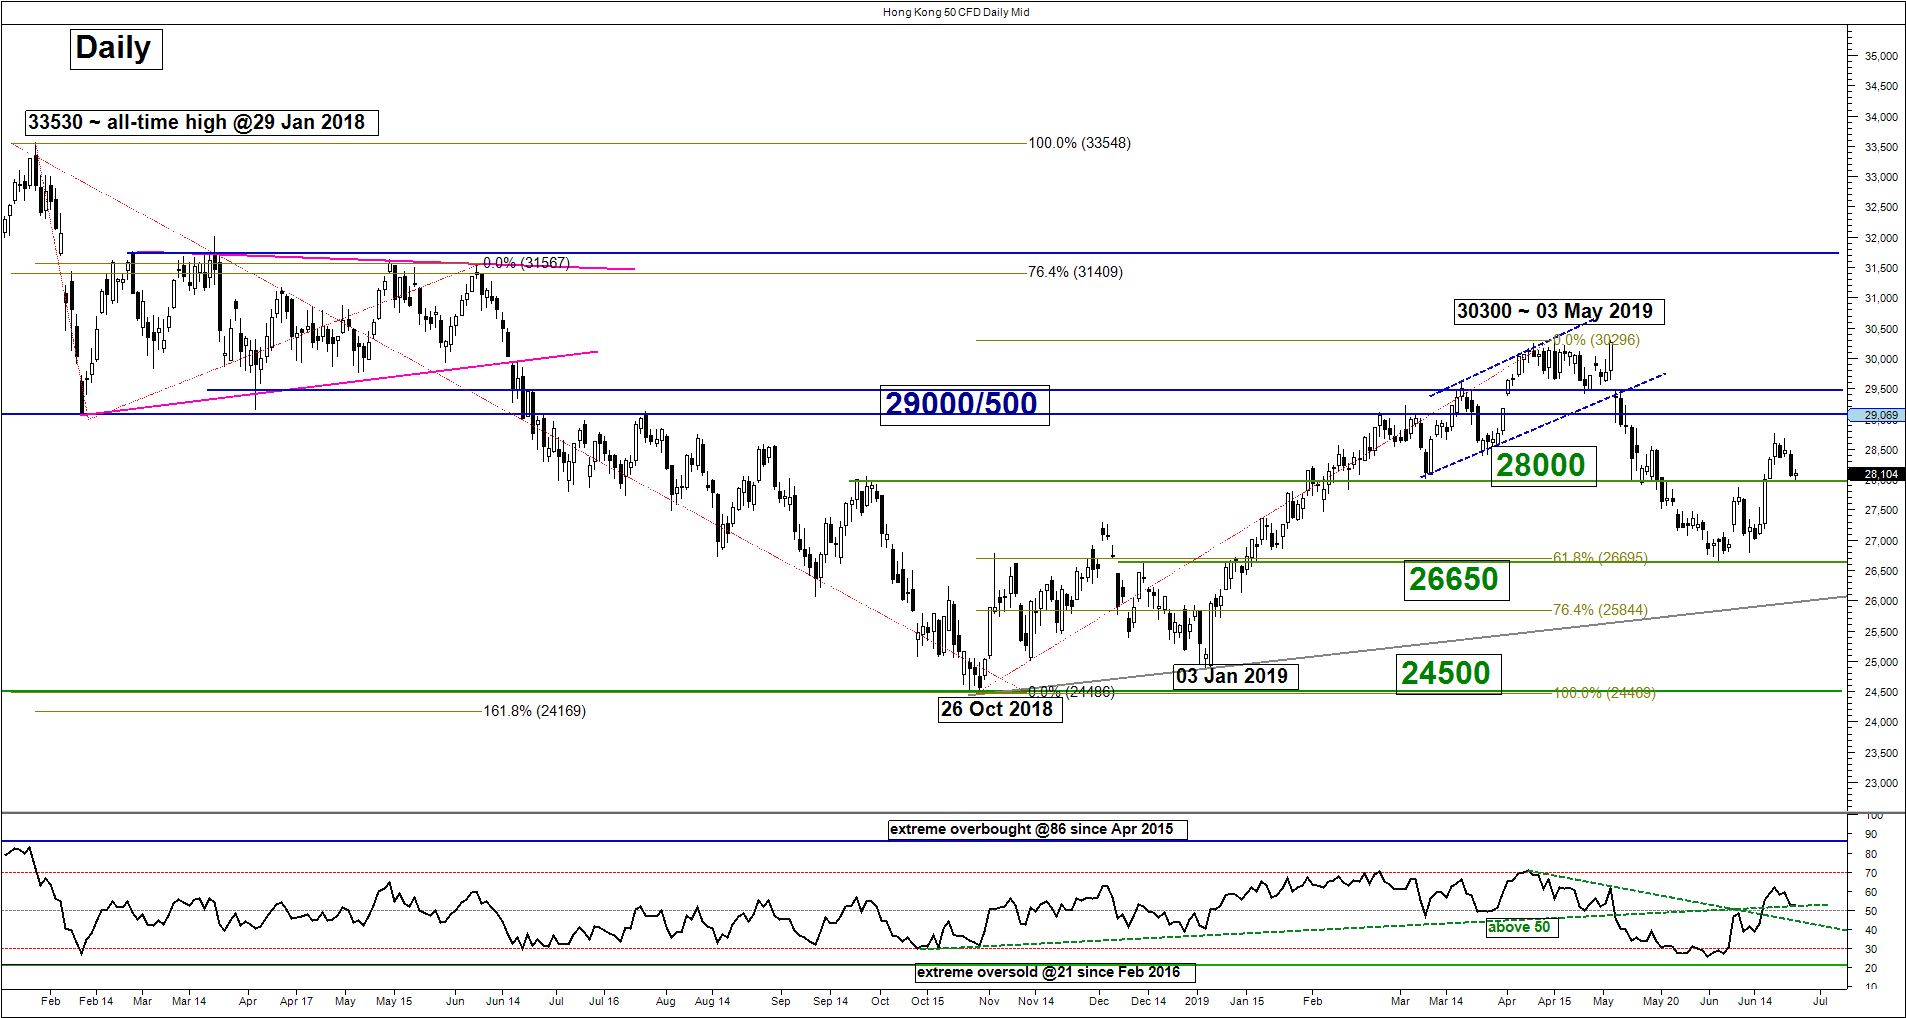
- Since its high of 28756 printed on 20 Jun 2019, the Hong Kong 50 Index (proxy for Hang Seng Index futures) has declined by -2.7% to print a current intraday low of 27982 as at today, 26 Jun Asian session.
- Interestingly, the decline has led to a test on the predefined key medium-term pivotal at 28000 (click here for a recap on our weekly technical outlook report) with positive elements.
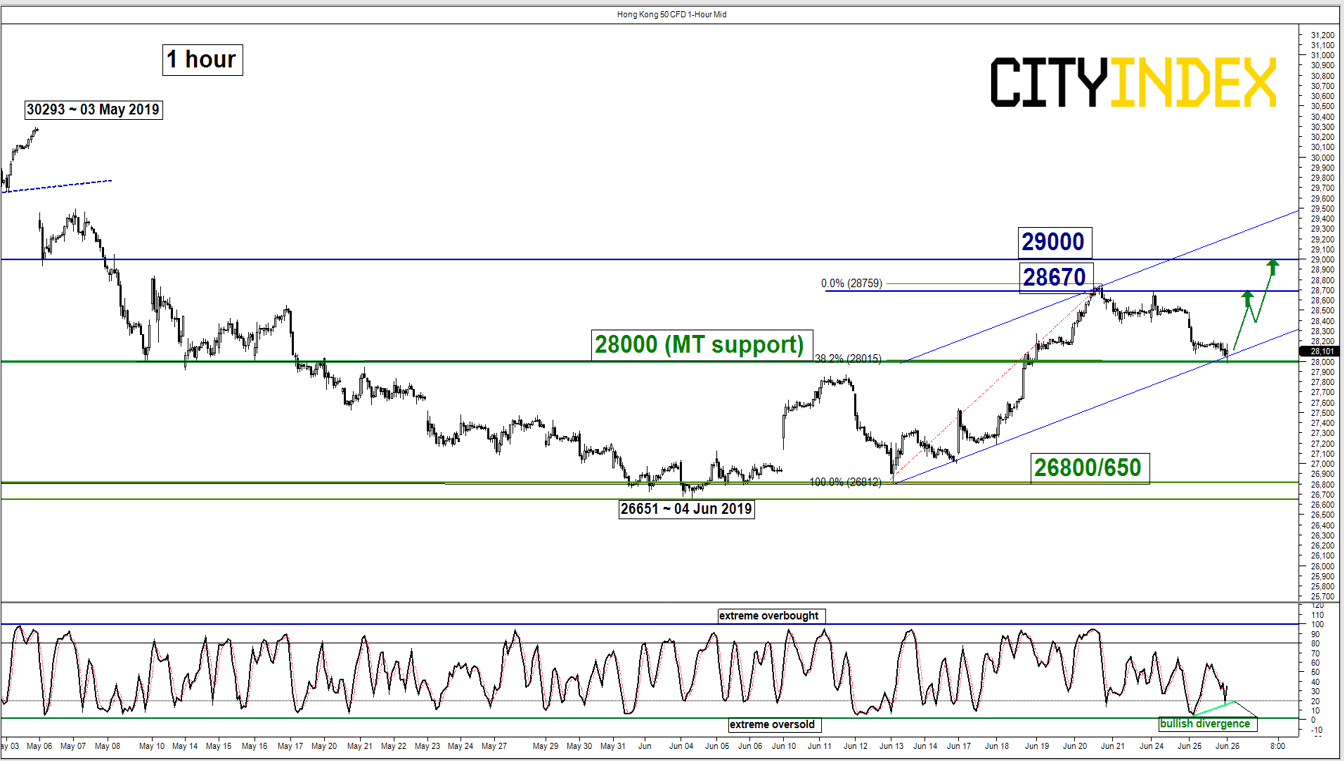
- The daily RSI oscillator is now resting on a significant corresponding support at the 50 level with a bullish divergence signal seen in the shorter-term hourly Stochastic oscillator at its extreme oversold level. These observations suggest that the recent downside momentum has started to ease.
- The 28000 key medium-term pivotal support also now confluences with the lower boundary of the minor ascending channel in place since 13 Jun 2019 low.
Key Levels (1 to 3 days)
Pivot (key support): 28000 (medium-term pivot)
Resistances: 28670 & 29000
Next support: 26800/650
Conclusion
If the 28000 key medium-term pivotal support holds, the Index is likely to see a potential recovery to retest the recent 20 Jun minor swing high area of 28670 before targeting the next resistance at 29000.
On the other hand, a daily close below 28000 invalidates the recovery scenario for a further decline towards the next support at 26800/650 (the aftermath of the recent local HK street protests over the China extradition bill).
Charts are from City Index Advantage TraderPro
StoneX Financial Ltd (trading as “City Index”) is an execution-only service provider. This material, whether or not it states any opinions, is for general information purposes only and it does not take into account your personal circumstances or objectives. This material has been prepared using the thoughts and opinions of the author and these may change. However, City Index does not plan to provide further updates to any material once published and it is not under any obligation to keep this material up to date. This material is short term in nature and may only relate to facts and circumstances existing at a specific time or day. Nothing in this material is (or should be considered to be) financial, investment, legal, tax or other advice and no reliance should be placed on it.
No opinion given in this material constitutes a recommendation by City Index or the author that any particular investment, security, transaction or investment strategy is suitable for any specific person. The material has not been prepared in accordance with legal requirements designed to promote the independence of investment research. Although City Index is not specifically prevented from dealing before providing this material, City Index does not seek to take advantage of the material prior to its dissemination. This material is not intended for distribution to, or use by, any person in any country or jurisdiction where such distribution or use would be contrary to local law or regulation.
For further details see our full non-independent research disclaimer and quarterly summary.
CFDs are complex instruments and come with a high risk of losing money rapidly due to leverage. 69% of retail investor accounts lose money when trading CFDs with this provider. You should consider whether you understand how CFDs work and whether you can afford to take the high risk of losing your money. CFD and Forex Trading are leveraged products and your capital is at risk. They may not be suitable for everyone. Please ensure you fully understand the risks involved by reading our full risk warning.
City Index is a trading name of StoneX Financial Ltd. Head and Registered Office: 1st Floor, Moor House, 120 London Wall, London, EC2Y 5ET. StoneX Financial Ltd is a company registered in England and Wales, number: 05616586. Authorised and regulated by the Financial Conduct Authority. FCA Register Number: 446717.
City Index is a trademark of StoneX Financial Ltd.
The information on this website is not targeted at the general public of any particular country. It is not intended for distribution to residents in any country where such distribution or use would contravene any local law or regulatory requirement.
© City Index 2024