Stocks European markets recover outlook remains uncertain
European stocks opened lower first thing this morning, before turning mixed by midday. The euro has correspondingly lost its earlier gains, and this has boosted the appeal of some export names slightly. But one such stock that has not found much support is Volkswagen which still remains down more than 20% on the day after confessing it had cheated US fuel emissions tests. Overall however it has been a quiet first half of the day so far due to the lack of any important economic data. And despite a slightly firmer tone as we start the second half of the day, sentiment remains cautious following the recent events in China and the US. Investors are still probably waiting on the side lines as the obvious positive implication on global equities of the US Federal Reserve’s decision last week to keep monetary policy unchanged has been counterbalanced by an argument that their actions – or lack therefore – imply that the global economic recovery trajectory is in a poorer shape than previously thought. At the same time, the Fed continues to talk up the prospects of a 2015 rate increase, which has left many people in a state of confusion about what this means for the health of the US economy and in turn the dollar and equities. This is why the immediate sharp moves we saw in the dollar and stocks quickly lost their momentum last week and this uncertainty is undoubtedly preventing many people who are already spooked by the prospects of slower global growth, most notably in China, from taking on too much risk. Previously, such sharp pullbacks in the markets would have led to an equally strong rally as traders “bought the dip.” This time however, we have only seen a modest recovery following last month’s sharp sell-off. Unfortunately, there are not much economic data scheduled for today to alter the outlook much, though we do have some important manufacturing PMI data to look forward to on Wednesdays from China and the Eurozone.
Euro Stoxx at a critical technical area
From a technical point of view, the Euro Stoxx 50 is looking fragile as the recovery that began at the end of last month could be coming to an end. This particular index is made up of fifty of the largest and most liquid stocks in the Eurozone. STOXX call it a blue-chip representation of “Supersector leaders” in the single currency bloc. Therefore what this index does, others may follow. So, its importance for the wider stock markets should not be understated.
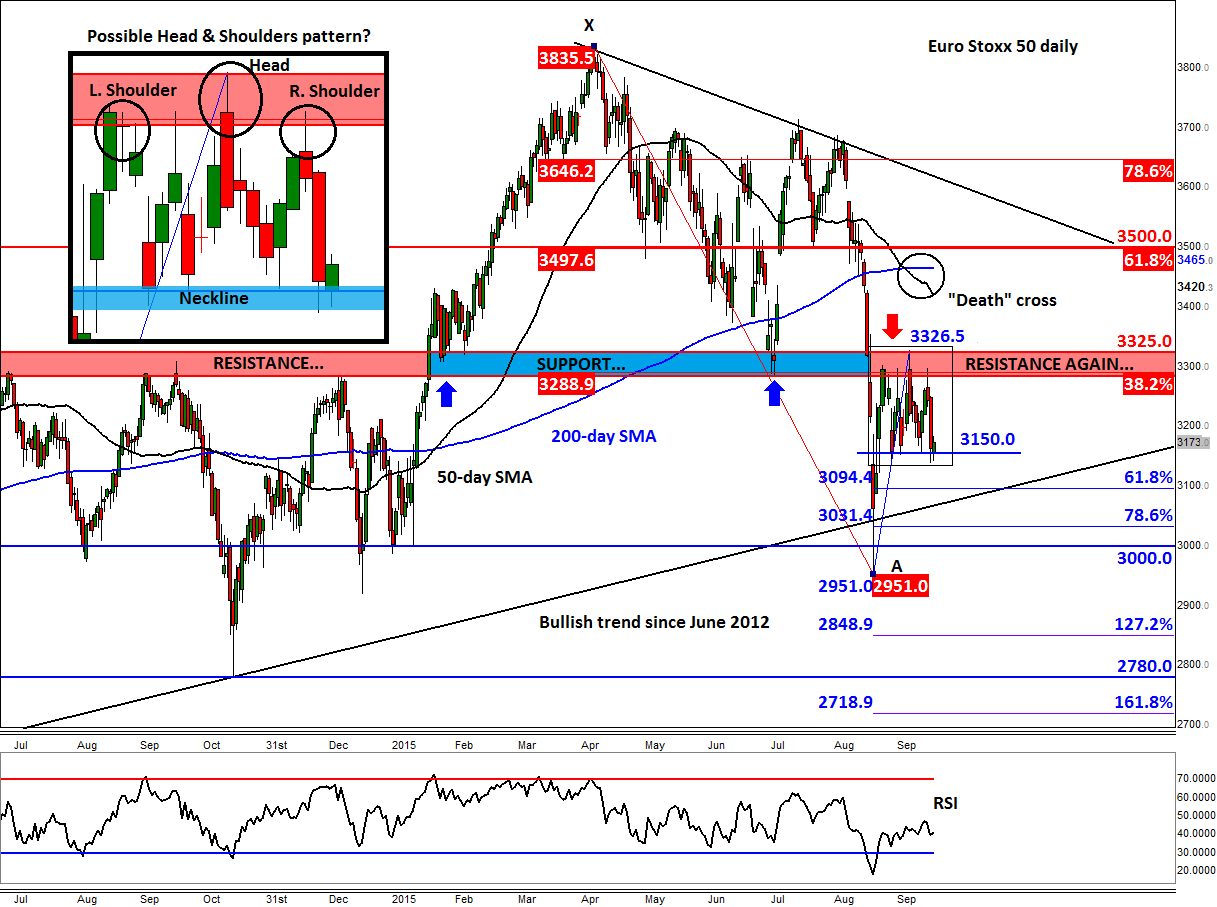
After that big sell-off in August, we have been waiting for the Euro Stoxx 50 to come back and re-test the resistance-turned-support area between 3285 and 3325 (shaded area in blue and red on the chart) in order to get a better feel for price action. As can be seen, the kick-back rally has stalled around this area after numerous attempts to break higher. The resulting behaviour of the index here has created a possible Head & Shoulders continuation pattern. The neckline of this pattern comes in around the 3150 area, which needs to break decisively in order to confirm the bearish momentum. The slightly longer sighted traders will have already noticed a so-called “death crossover” pattern which is when the 50-day moving average moves below the 200.
A decisive break below the abovementioned 3150 support area could therefore lead to further follow-up technical selling. But despite all these bearish indications, the sellers will need to be careful as the index is still holding above a long-term bullish trend line that has been established since the European stock markets bottomed in the summer of 2012. Incidentally, this trend line cuts through the 61.8 and 78.6 per cent Fibonacci retracement levels (at 3030 and 3095, respectively) of the corrective move that began at the end of last month (point A on the chart). This means therefore that there is still a possibility that index may bounce back or even bottom out here before staging a rally towards the year-end. Even then, the bulls will have to push the index back above that 3285-3325 resistance area before fresh buyers can be encouraged to join the potential rally.
However if no such rally is materialised around these levels then the exiting bulls may throw in the towel and say “if you can’t beat ‘em, join ‘em!” Undoubtedly, this will help to accelerate the potential sell-off and the index may even go on to take out the August low of 2950 before moving towards the October low at 2780.
StoneX Financial Ltd (trading as “City Index”) is an execution-only service provider. This material, whether or not it states any opinions, is for general information purposes only and it does not take into account your personal circumstances or objectives. This material has been prepared using the thoughts and opinions of the author and these may change. However, City Index does not plan to provide further updates to any material once published and it is not under any obligation to keep this material up to date. This material is short term in nature and may only relate to facts and circumstances existing at a specific time or day. Nothing in this material is (or should be considered to be) financial, investment, legal, tax or other advice and no reliance should be placed on it.
No opinion given in this material constitutes a recommendation by City Index or the author that any particular investment, security, transaction or investment strategy is suitable for any specific person. The material has not been prepared in accordance with legal requirements designed to promote the independence of investment research. Although City Index is not specifically prevented from dealing before providing this material, City Index does not seek to take advantage of the material prior to its dissemination. This material is not intended for distribution to, or use by, any person in any country or jurisdiction where such distribution or use would be contrary to local law or regulation.
For further details see our full non-independent research disclaimer and quarterly summary.
CFDs are complex instruments and come with a high risk of losing money rapidly due to leverage. 69% of retail investor accounts lose money when trading CFDs with this provider. You should consider whether you understand how CFDs work and whether you can afford to take the high risk of losing your money. CFD and Forex Trading are leveraged products and your capital is at risk. They may not be suitable for everyone. Please ensure you fully understand the risks involved by reading our full risk warning.
City Index is a trading name of StoneX Financial Ltd. Head and Registered Office: 1st Floor, Moor House, 120 London Wall, London, EC2Y 5ET. StoneX Financial Ltd is a company registered in England and Wales, number: 05616586. Authorised and regulated by the Financial Conduct Authority. FCA Register Number: 446717.
City Index is a trademark of StoneX Financial Ltd.
The information on this website is not targeted at the general public of any particular country. It is not intended for distribution to residents in any country where such distribution or use would contravene any local law or regulatory requirement.
© City Index 2024