Stock Selection US shares Micron Technology due for a corrective rebound
Micron Technology (MU)
click to enlarge chart
Key technical elements
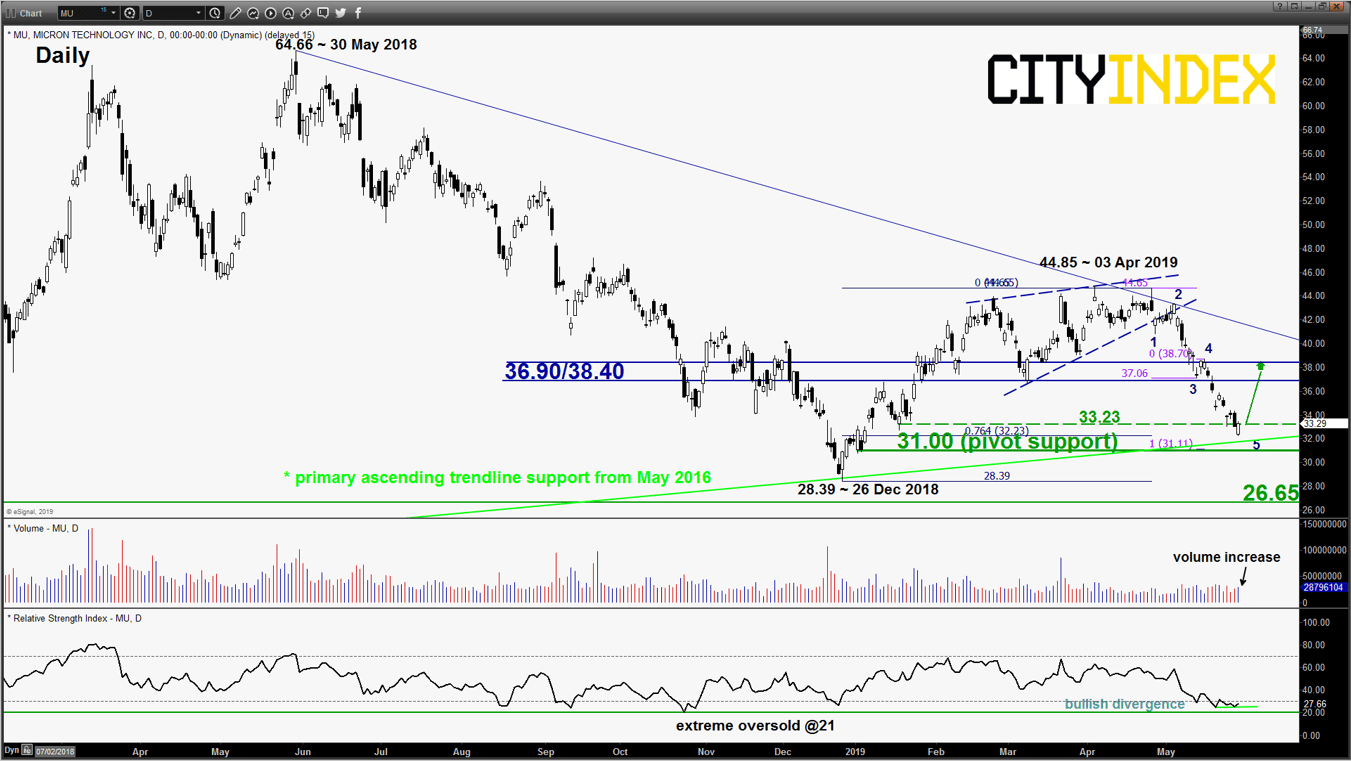
- In our previous “Stock Selection” report dated on 08 May 2019; we had highlighted a bearish setup in Micron Technology (MU). Its share price had declined as expected and hit the support/target of 32.75. Yesterday, 29 May, it printed a low of 32.17 (click here for a recap on our previous report).
- Right now, MU has managed to close higher from yesterday’s open of 32.32 right above a primary ascending trendline support from May 2016.
- Several elements have been sighted to indicate a potential short to medium-term corrective rebound to retrace the on-going impulsive down move from 03 Apr 2019 high to yesterday, 29 May low of 32.17.
- Yesterday’s rebound has been accompanied by an increase in volume above its prior average 3-day volume coupled with the daily RSI oscillator that has traced out a bullish divergence signal at its oversold region.
- Elliot Wave/fractal analysis has indicated that a completed 5-wave impulsive down move sequence of an intermediate degree from 25 Apr 2019 high which suggests the risk of an imminent corrective rebound.
- The next significant medium-term resistance zone stands at 36.90/38.40 which is also the 50% Fibonacci retracement of the on-going down move from 03 Apr to 29 May 2019 high.
Key Levels (1 to 3 weeks)
Intermediate support: 33.23
Pivot (key support): 31.00
Resistance: 36.90/38.40
Next supports: 28.39 & 26.65
Conclusion
If MU manages to hold at the 31.00 key medium-term pivotal support, it is likely to undergo a potential corrective rebound to target the 36.90/38.40 resistance zone.
On the other hand, a daily close below 31.00 invalidates the corrective rebound scenario for a continuation of the impulsive down move to retest the key 26 Dec 2018 low of 28.39 before targeting the next support at 26.65 (swing low areas of 12 Apr/10 Aug 2017).
Charts are from eSignal
StoneX Financial Ltd (trading as “City Index”) is an execution-only service provider. This material, whether or not it states any opinions, is for general information purposes only and it does not take into account your personal circumstances or objectives. This material has been prepared using the thoughts and opinions of the author and these may change. However, City Index does not plan to provide further updates to any material once published and it is not under any obligation to keep this material up to date. This material is short term in nature and may only relate to facts and circumstances existing at a specific time or day. Nothing in this material is (or should be considered to be) financial, investment, legal, tax or other advice and no reliance should be placed on it.
No opinion given in this material constitutes a recommendation by City Index or the author that any particular investment, security, transaction or investment strategy is suitable for any specific person. The material has not been prepared in accordance with legal requirements designed to promote the independence of investment research. Although City Index is not specifically prevented from dealing before providing this material, City Index does not seek to take advantage of the material prior to its dissemination. This material is not intended for distribution to, or use by, any person in any country or jurisdiction where such distribution or use would be contrary to local law or regulation.
For further details see our full non-independent research disclaimer and quarterly summary.
CFDs are complex instruments and come with a high risk of losing money rapidly due to leverage. 69% of retail investor accounts lose money when trading CFDs with this provider. You should consider whether you understand how CFDs work and whether you can afford to take the high risk of losing your money. CFD and Forex Trading are leveraged products and your capital is at risk. They may not be suitable for everyone. Please ensure you fully understand the risks involved by reading our full risk warning.
City Index is a trading name of StoneX Financial Ltd. Head and Registered Office: 1st Floor, Moor House, 120 London Wall, London, EC2Y 5ET. StoneX Financial Ltd is a company registered in England and Wales, number: 05616586. Authorised and regulated by the Financial Conduct Authority. FCA Register Number: 446717.
City Index is a trademark of StoneX Financial Ltd.
The information on this website is not targeted at the general public of any particular country. It is not intended for distribution to residents in any country where such distribution or use would contravene any local law or regulatory requirement.
© City Index 2024