Stock Selection US shares Bullish elements sighted in Citigroup
Citigroup (C)
click to enlarge charts
Key technical elements
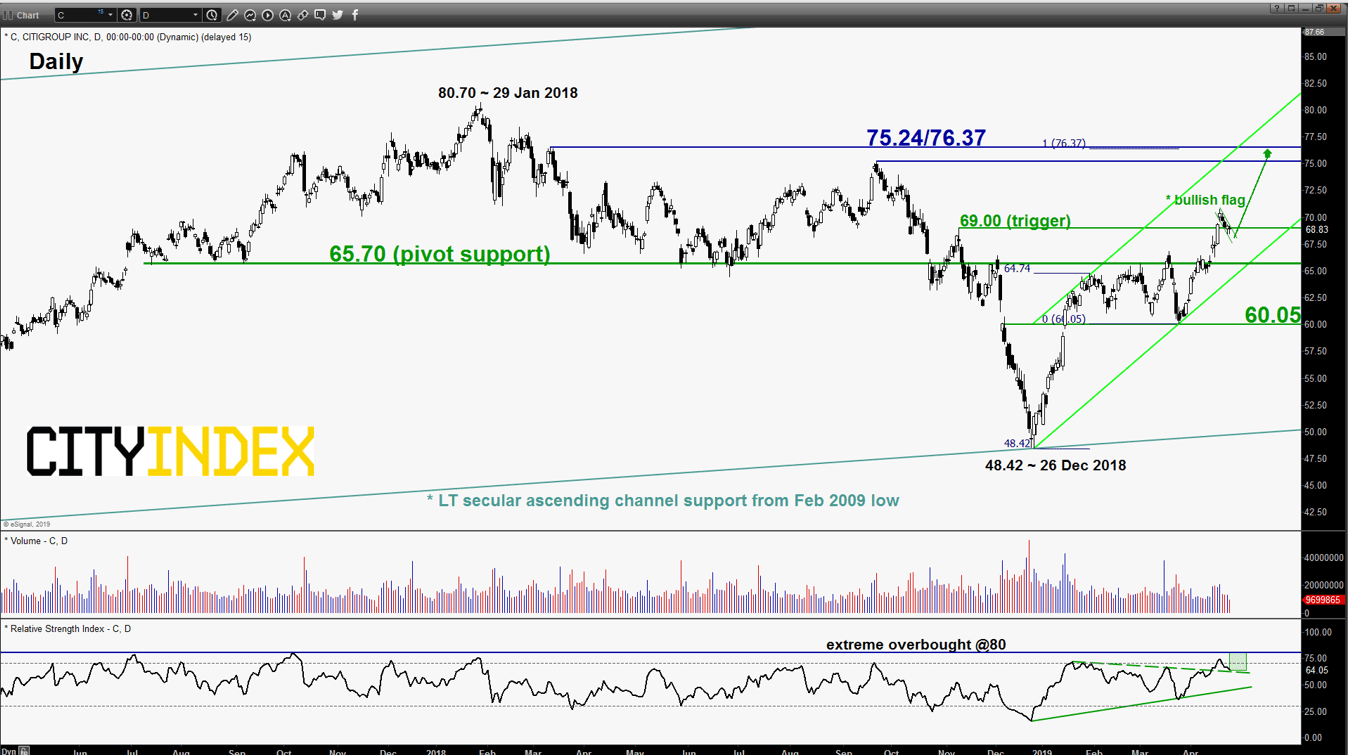
- Since its high of 70.75 printed on 17 Apr 2019, the share price of Citigroup has declined by 3.7% to print a low of 68.38 on 23 Apr 2019. Interestingly, the decline has evolved into a positive “bullish flag” continuation chart pattern with is upper boundary/resistance at 69.00.
- Momentum remains positive as the daily RSI oscillator has not flash any bearish divergence signal and still has potential room to manoeuvre to the upside before it reaches an extreme overbought level of 80.
- Th key medium-term support rests at 65.70 which is defined by the former swing high area of 01/18 Mar 2019 and the lower boundary of the medium-term ascending channel from 26 Dec 2018 low.
- The next significant medium-term resistance stands at 75.24/76.37 which is defined the swing high areas of 13 Mar/21 Sep 2018 and 1.00 Fibonacci expansion of the up move from 26 Dec 2018 low to 30 Jan 2019 high projected from 25 Mar 2019 low.
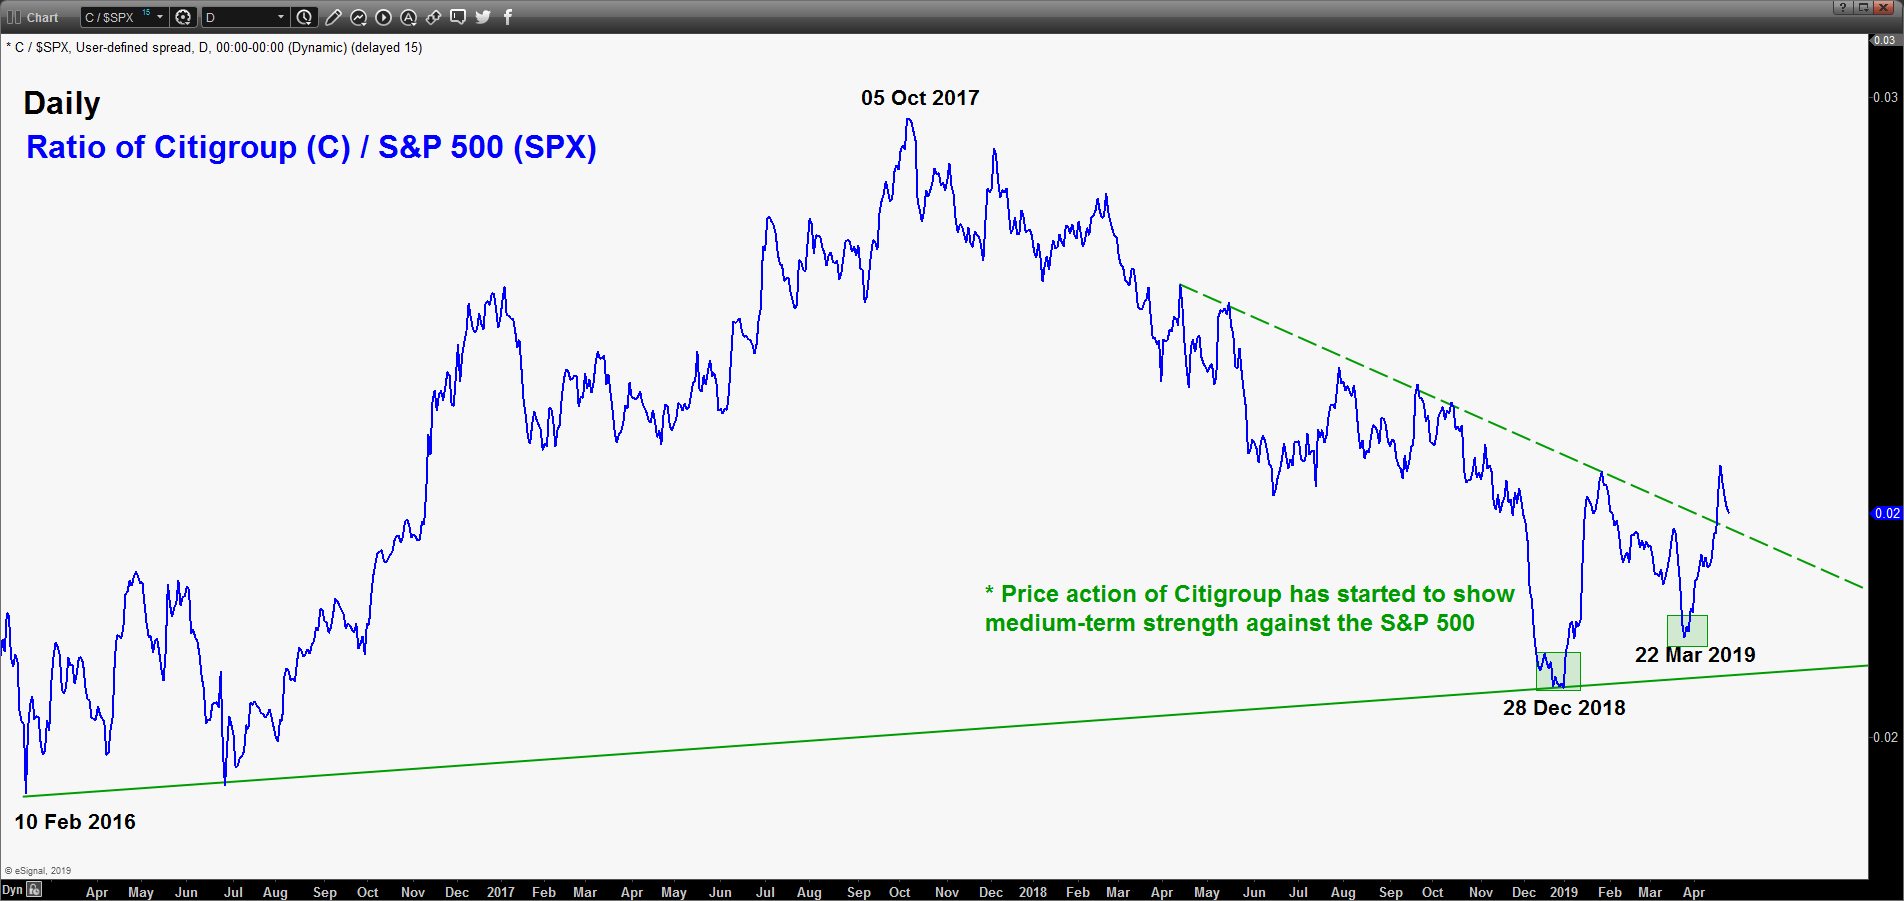
- The ratio of Citigroup / S&P 500 has started to exhibit medium-term strength seen in the share price movement of Citigroup against the S&P 500.
Key Levels (1 to 3 weeks)
Pivot (key support): 65.70
Resistances: 69.00 (trigger) & 75.24/76.37
Next support: 60.05
Conclusion
If the 65.70 key medium-term pivotal support holds and a break above 69.00 is likely to reinforce another potential upleg for Citigroup to target the 75.24/76.37 resistance zone.
However, a break with a daily close below 65.70 invalidates the bullish scenario for a corrective decline towards the next support at 60.05 (25 Mar 2019 swing low & close to 50% Fibonacci retracement of the entire 3-month up move from 26 Dec 2018 low to 17 Apr 2019 high).
Charts are from eSignal
StoneX Financial Ltd (trading as “City Index”) is an execution-only service provider. This material, whether or not it states any opinions, is for general information purposes only and it does not take into account your personal circumstances or objectives. This material has been prepared using the thoughts and opinions of the author and these may change. However, City Index does not plan to provide further updates to any material once published and it is not under any obligation to keep this material up to date. This material is short term in nature and may only relate to facts and circumstances existing at a specific time or day. Nothing in this material is (or should be considered to be) financial, investment, legal, tax or other advice and no reliance should be placed on it.
No opinion given in this material constitutes a recommendation by City Index or the author that any particular investment, security, transaction or investment strategy is suitable for any specific person. The material has not been prepared in accordance with legal requirements designed to promote the independence of investment research. Although City Index is not specifically prevented from dealing before providing this material, City Index does not seek to take advantage of the material prior to its dissemination. This material is not intended for distribution to, or use by, any person in any country or jurisdiction where such distribution or use would be contrary to local law or regulation.
For further details see our full non-independent research disclaimer and quarterly summary.
CFDs are complex instruments and come with a high risk of losing money rapidly due to leverage. 69% of retail investor accounts lose money when trading CFDs with this provider. You should consider whether you understand how CFDs work and whether you can afford to take the high risk of losing your money. CFD and Forex Trading are leveraged products and your capital is at risk. They may not be suitable for everyone. Please ensure you fully understand the risks involved by reading our full risk warning.
City Index is a trading name of StoneX Financial Ltd. Head and Registered Office: 1st Floor, Moor House, 120 London Wall, London, EC2Y 5ET. StoneX Financial Ltd is a company registered in England and Wales, number: 05616586. Authorised and regulated by the Financial Conduct Authority. FCA Register Number: 446717.
City Index is a trademark of StoneX Financial Ltd.
The information on this website is not targeted at the general public of any particular country. It is not intended for distribution to residents in any country where such distribution or use would contravene any local law or regulatory requirement.
© City Index 2024