Stock Indices Weekly Technical Outlook New all time high US stock market with euphoric mood
S&P 500 – 3120 met with FOMO traits
click to enlarge charts
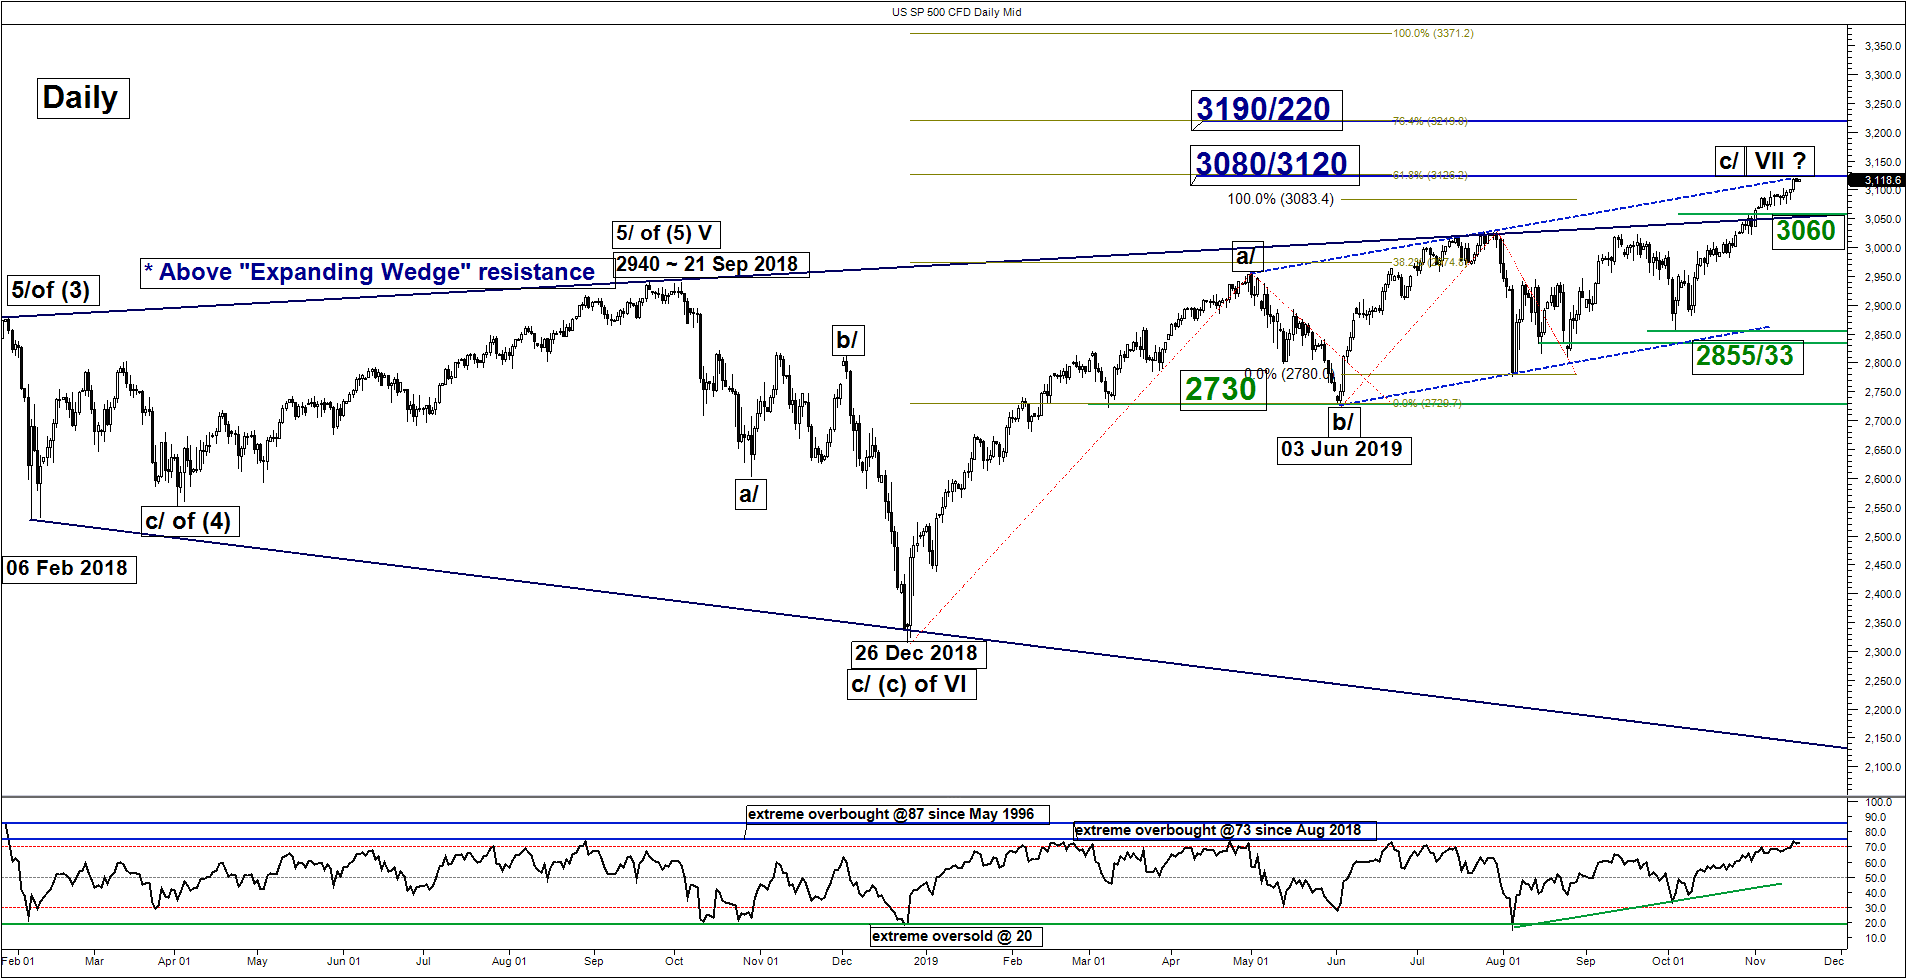
The SP 500 Index (proxy for the S&P 500 futures) has continued to inch higher and hit the 3120 key medium-term pivotal resistance in last Fri, 15 Nov as per highlighted in our previous report (click here for recap) on the back drop of another round of U.S-China Phase One trade deal optimism. Also, health care related stocks have contributed the bulk of last Fri, 15 Nov up move where the Health Care sector (XLV) ETF staged a rally of 2.2% (the best performing sector) after the U.S. White House announced an initiative to increase price transparency from hospitals and insurers.
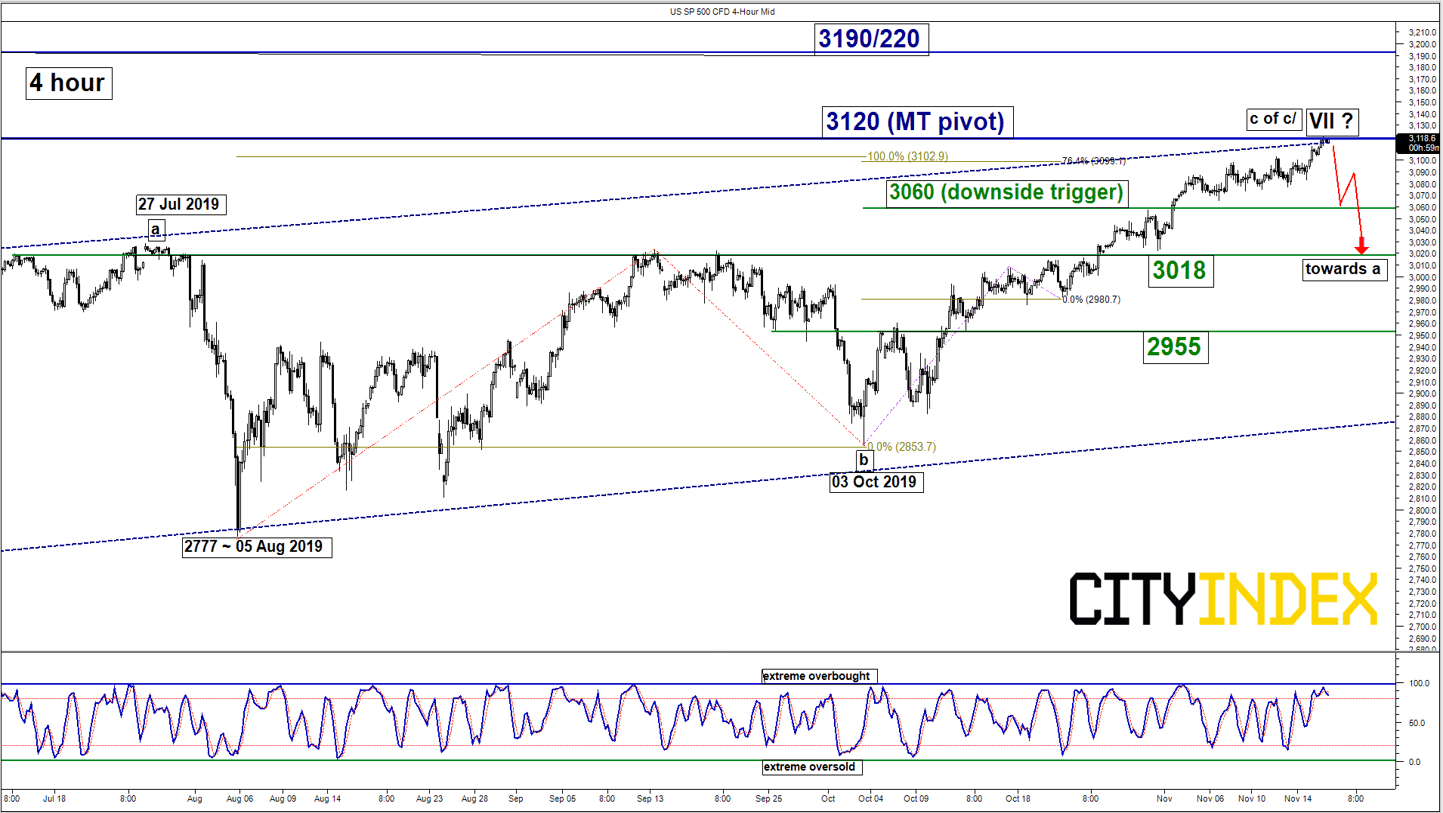
Maintain bearish bias with 3120 remains as the key medium-term pivotal resistance and a break below 3060 is required to reinforce the start of a potential corrective down move to target the next support at 3018 in the first step.
However, a clearance with a daily close above 3120 invalidates the bearish scenario for a further squeeze up towards the next resistance 3190/220 (Fibonacci expansion cluster).
Key elements
- 30060 downside trigger level is defined by the pull-back support of the former major “Expanding Wedge” range resistance (see daily chart).
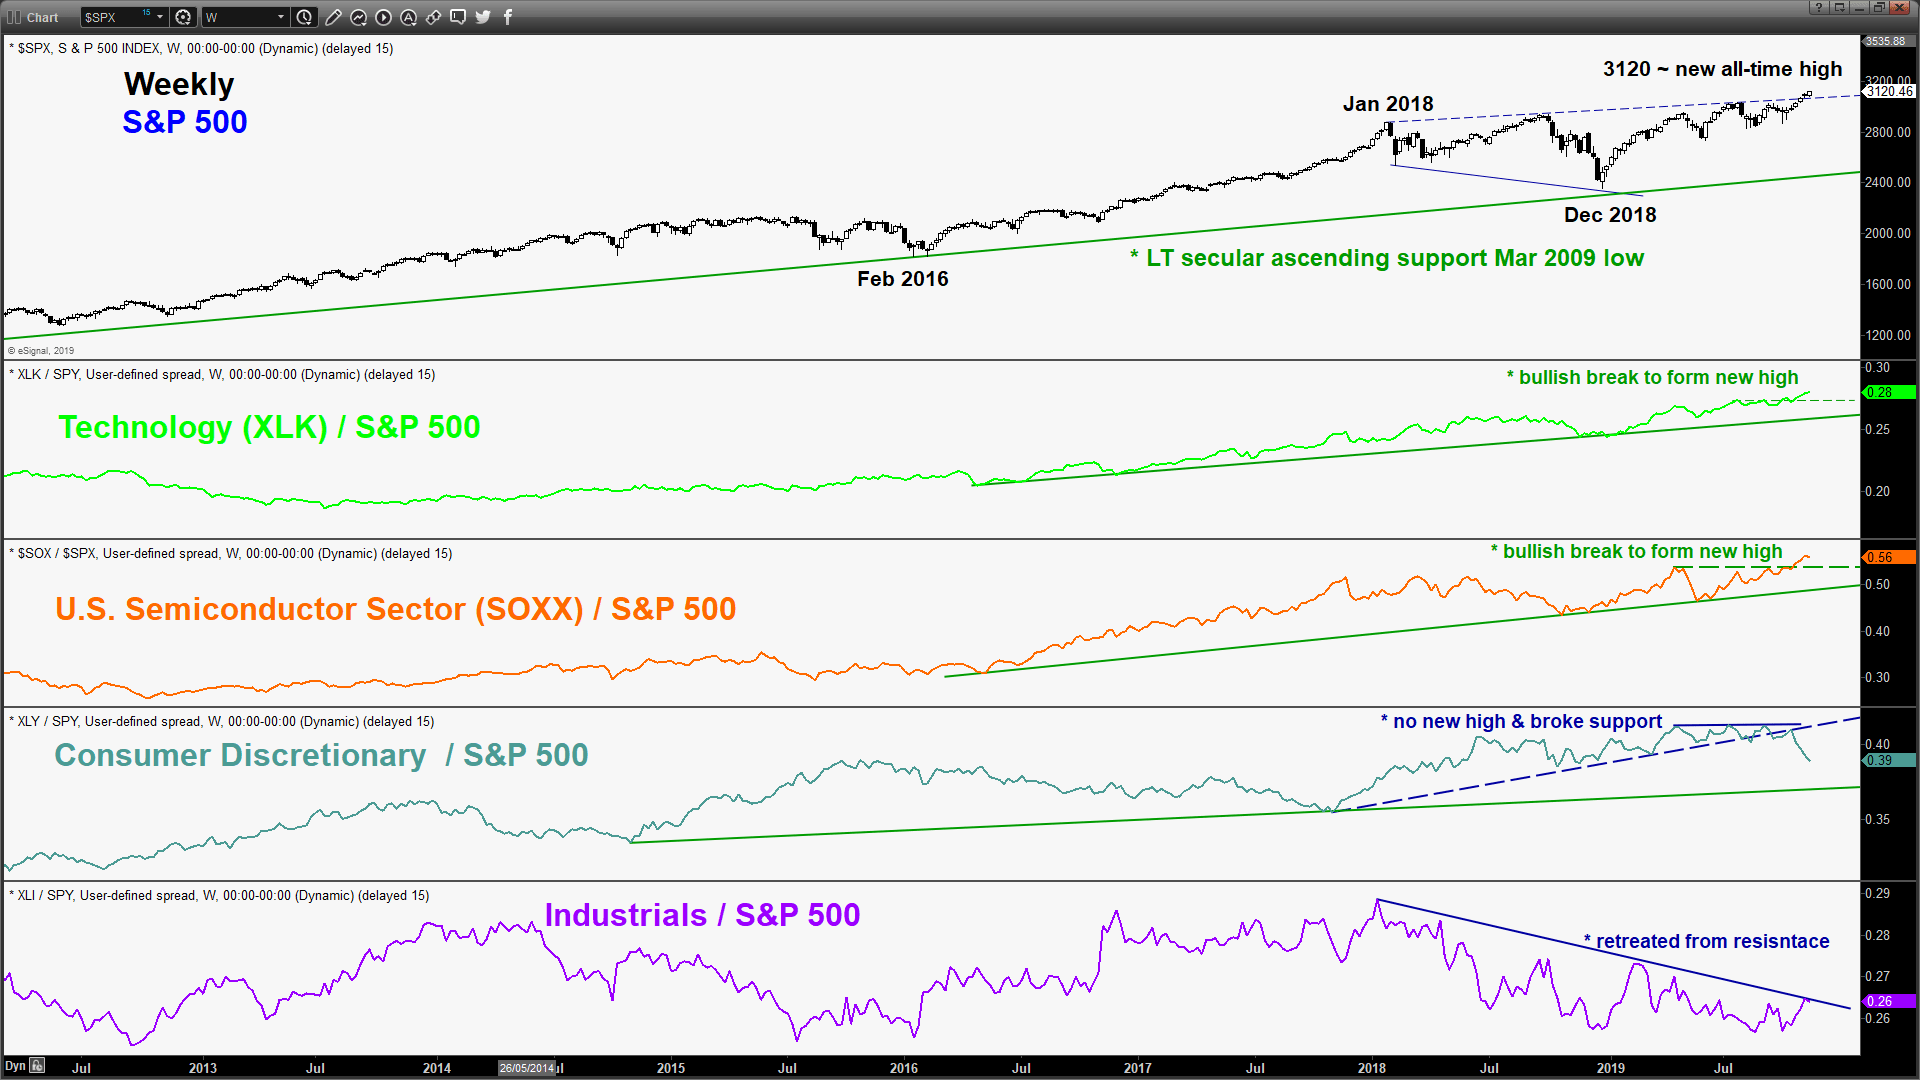
- From a relative strength analysis on the key “risk-on” sectors, the Consumer Discretionary (XLY) and Industrial (XLI) are still now showing any signs of clear outperformance against the S&P 500. Both these sectors have a combined weightage of 19% versus a 22% weightage in the Technology sector (XLK).
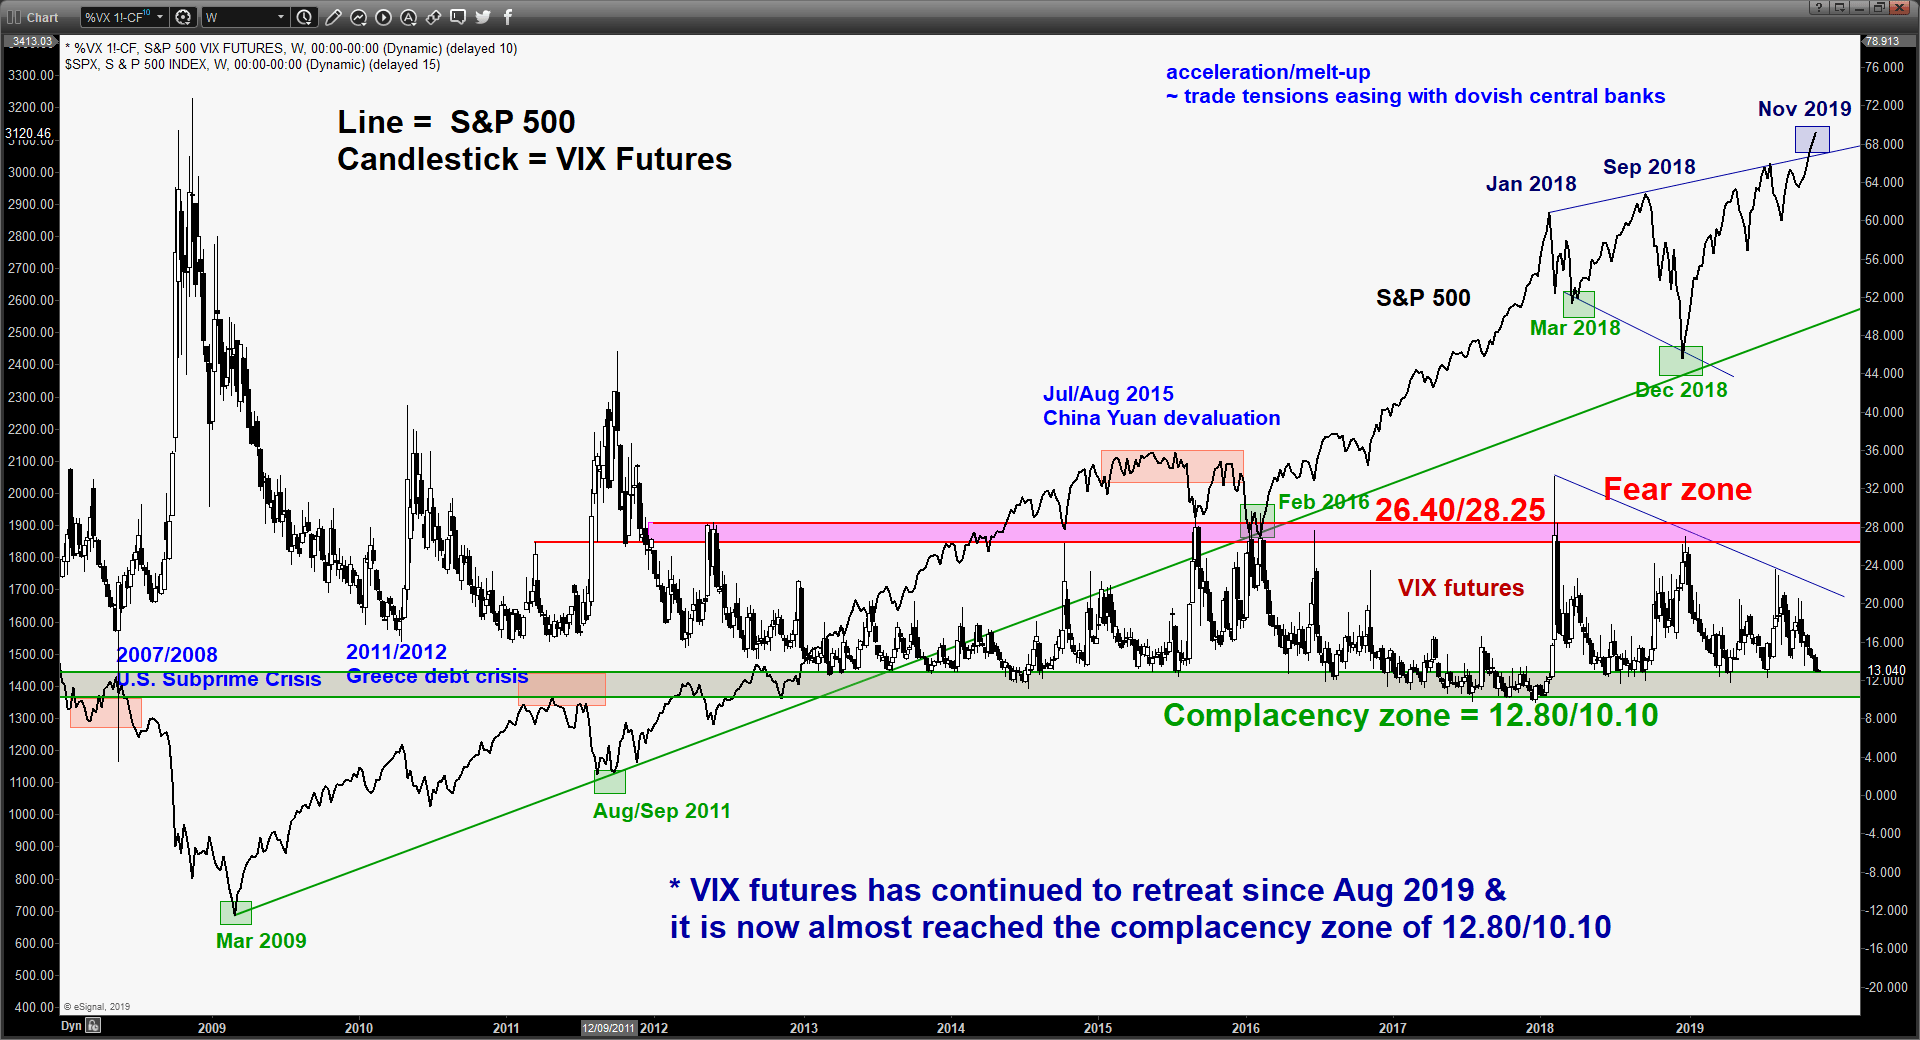
- The VIX futures has continued to drift downwards to print a low of 12.85 on last Fri, 15 Nov where it is now hovering right at the 12.80/10.10 “complacency zone”. From a contrary opinion perspective, this observation indicates a relatively high degree of “greed/fear of missing out” behaviour traits where the risk of a downside reversal in price action increases at this juncture as any price sensitive news flow can disappoint the mood of the market easily.
Nikkei 225 – Further potential drop
click to enlarge charts
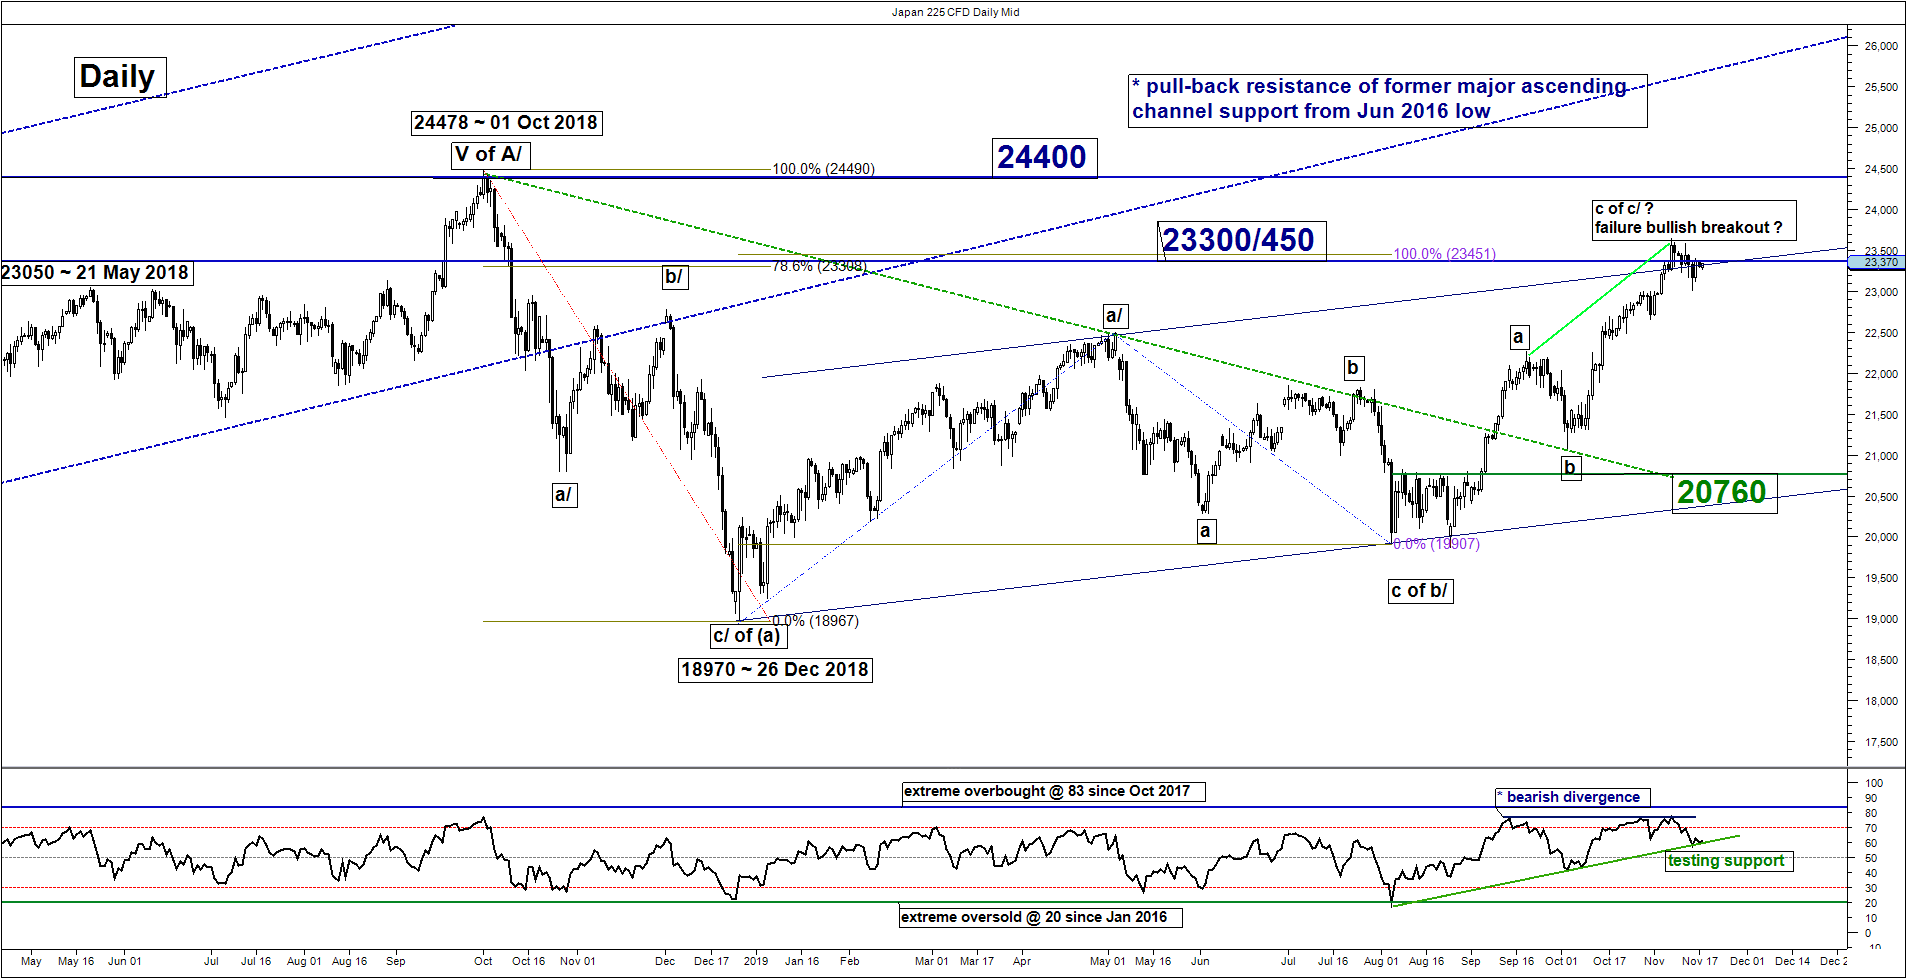
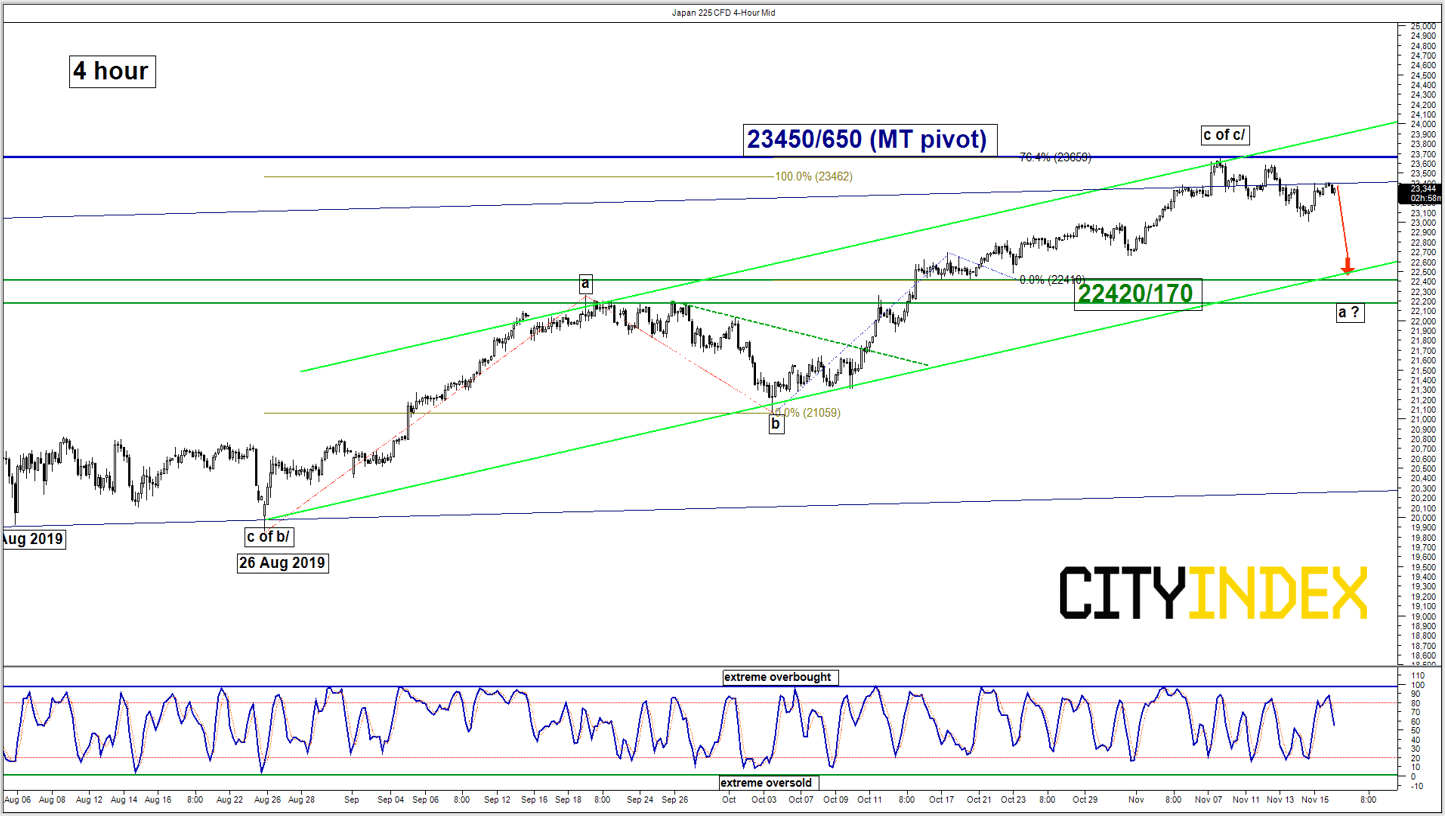
Key Levels (1 to 3 weeks)
Pivot (key resistance): 23450/23650 (excess)
Support: 22420/170
Next resistance: 24400
Directional Bias (1 to 3 weeks)
The Japan 225 Index (proxy for the Nikkei 225 futures) has drifted down as expected by -2.3% from 12 Nov high of 23582 to print a low of 23012 on 14 Nov before it retraced 61.8 of the earlier losses on last Fri, 15 Nov.
Maintain bearish bias below the 23650 (excess) medium-term pivotal resistance for a further potential drop towards the 22420/170 support zone. However, a clearance with a daily close above 23650 invalidates the bearish scenario for an extension of the up move towards the next resistance at 24400 (01 Oct 2018 major swing high area).
Key elements
- The daily RSI oscillator is now testing a corresponding ascending support from its oversold region after a bearish divergence signal formed on 28 Oct 2019. A break below the ascending support reinforces a further drop in price action.
- The 22420/170 support is defined by the lower boundary of the medium-term ascending channel in place since 26 Aug 2019 low and a Fibonacci retracement cluster.
Hang Seng – Bounce before another potential leg of corrective decline
click to enlarge charts
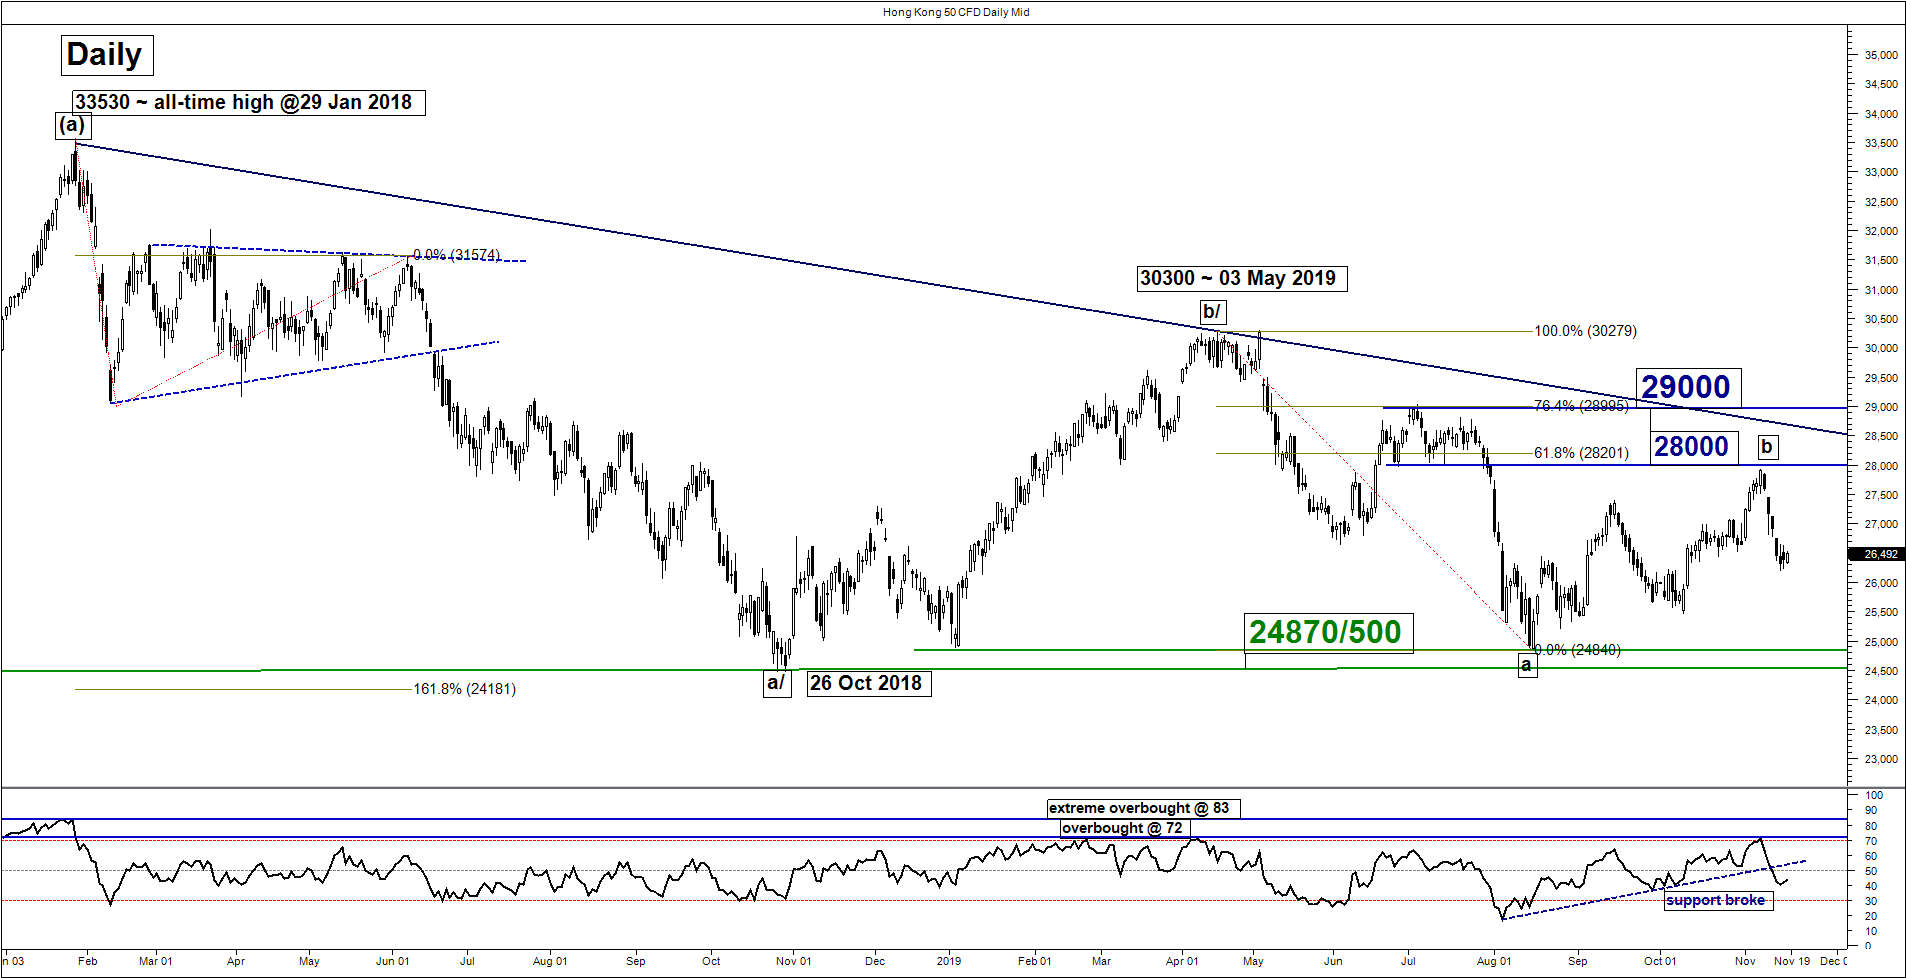
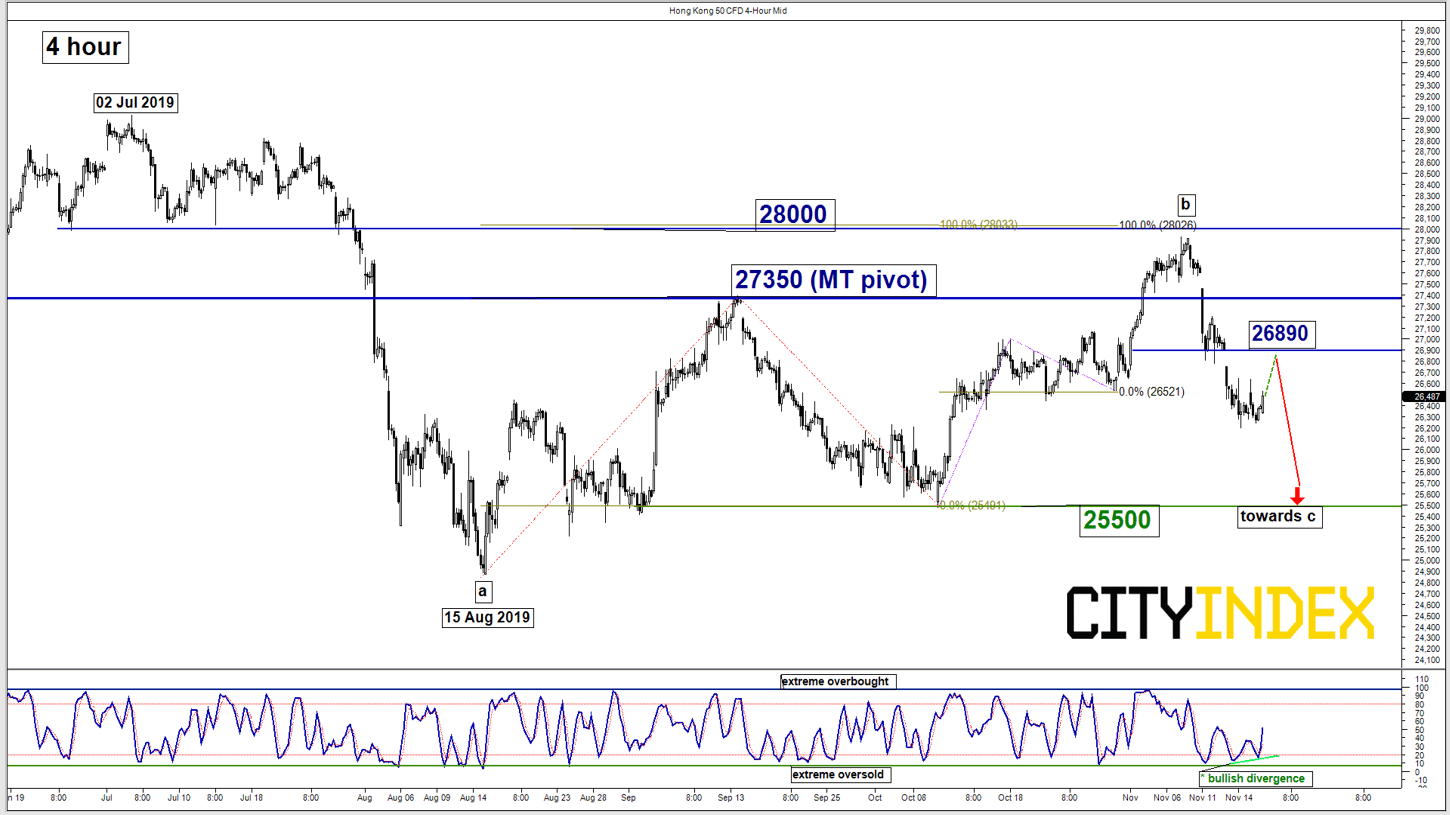
Key Levels (1 to 3 weeks)
Intermediate resistance: 26890
Pivot (key resistance): 27350
Support: 25500
Next resistance: 28000
Directional Bias (1 to 3 weeks)
The Hong Kong 50 Index (proxy for Hang Seng Index futures) has tumbled as expected and almost met the 26100 downside target/support as per highlighted in our previous report (printed a low of 26197 on 14 Nov).
Maintain bearish bias in any bounces below adjusted key medium-term pivotal resistance now at 27350 for another potential corrective down move to target the next support at 25500 (10 Oct 2019 swing low & 76.4% Fibonacci retracement of the up move from 15 Aug low to 07 Nov 2019 high).
However, a clearance with a daily close above 27350 negates the bearish tone for a push up to retest 28000
Key elements
- The daily RSI oscillator has broken below a corresponding ascending support from its oversold region which reinforces a revival of medium-term downside momentum.
- The shorter-term 4-hour Stochastic oscillator has exited its oversold region with a prior bullish divergence signal that indicates last week’s price action decline has been overstretched. The Index now faces the risk of a minor rebound towards the gap resistance of 26890.
- The 27350 key medium-term pivotal resistance is defined by the former medium-term swing high of 13 Sep 2019 and close to the 61.8% Fibonacci retracement of the recent decline from 07 Nov high to 15 Nov 2019 low.
ASX 200 – Tolerate the excess resistance to 6800
click to enlarge charts
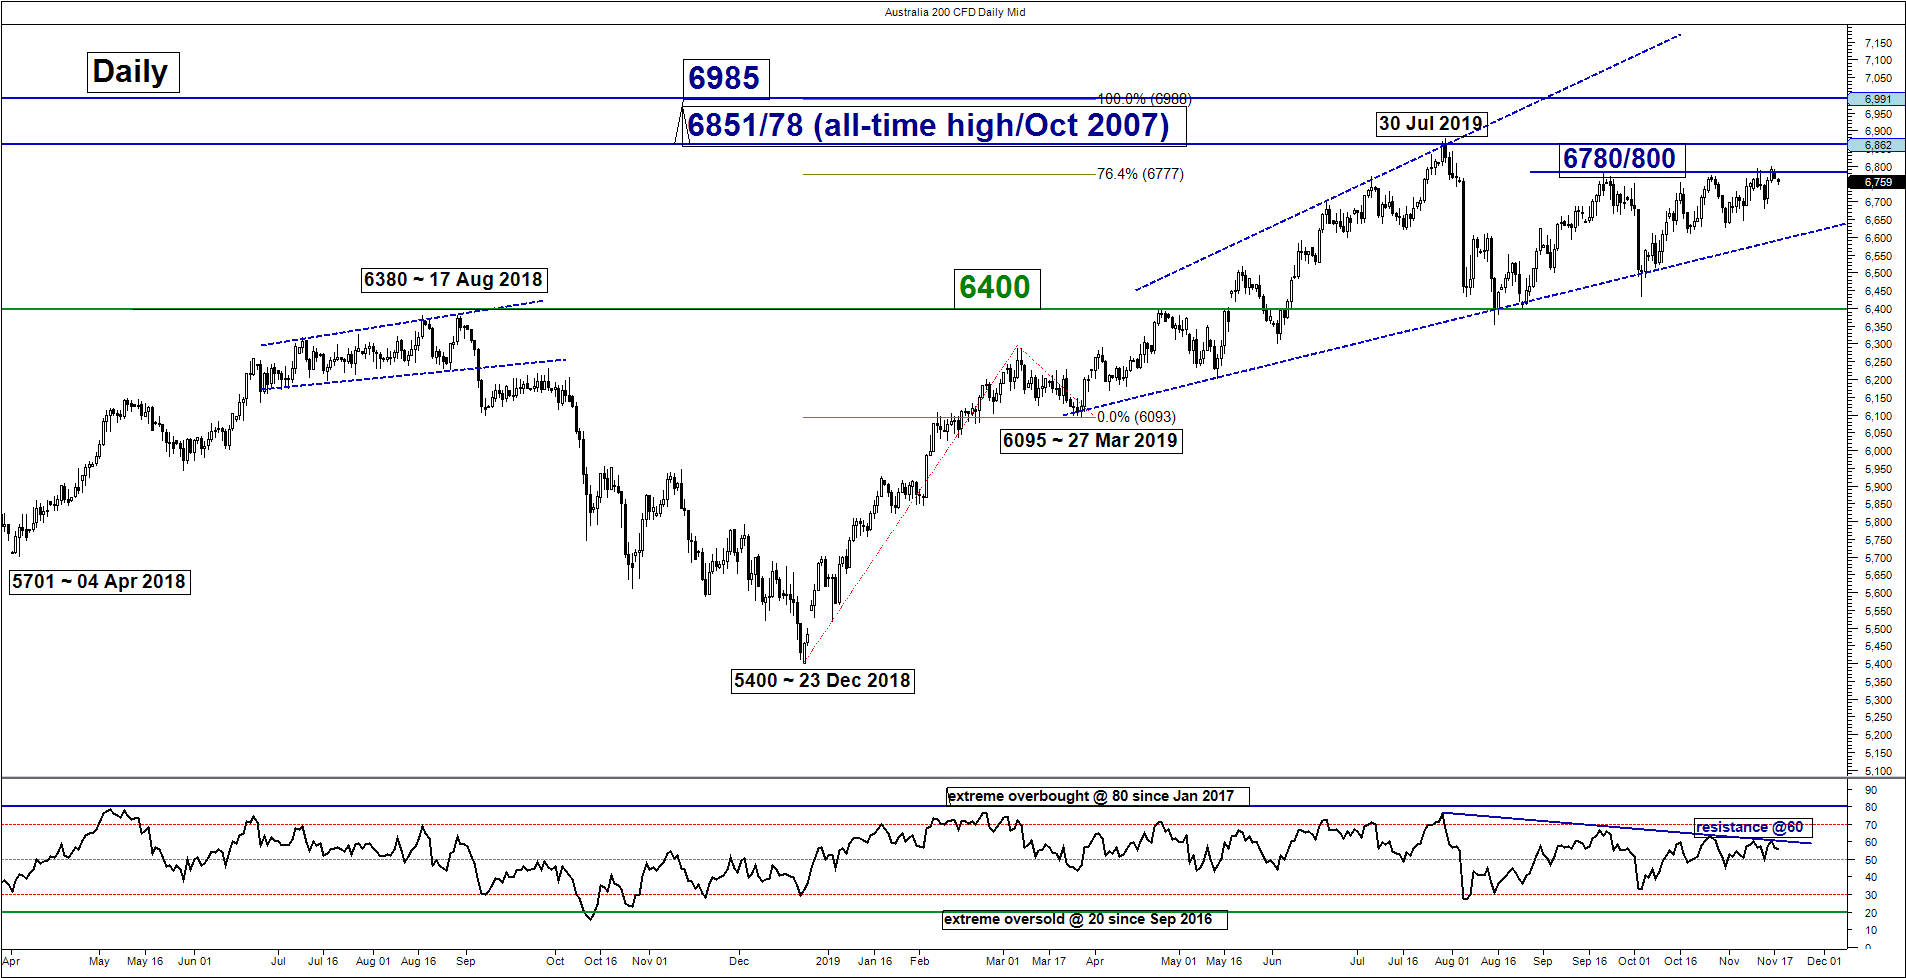
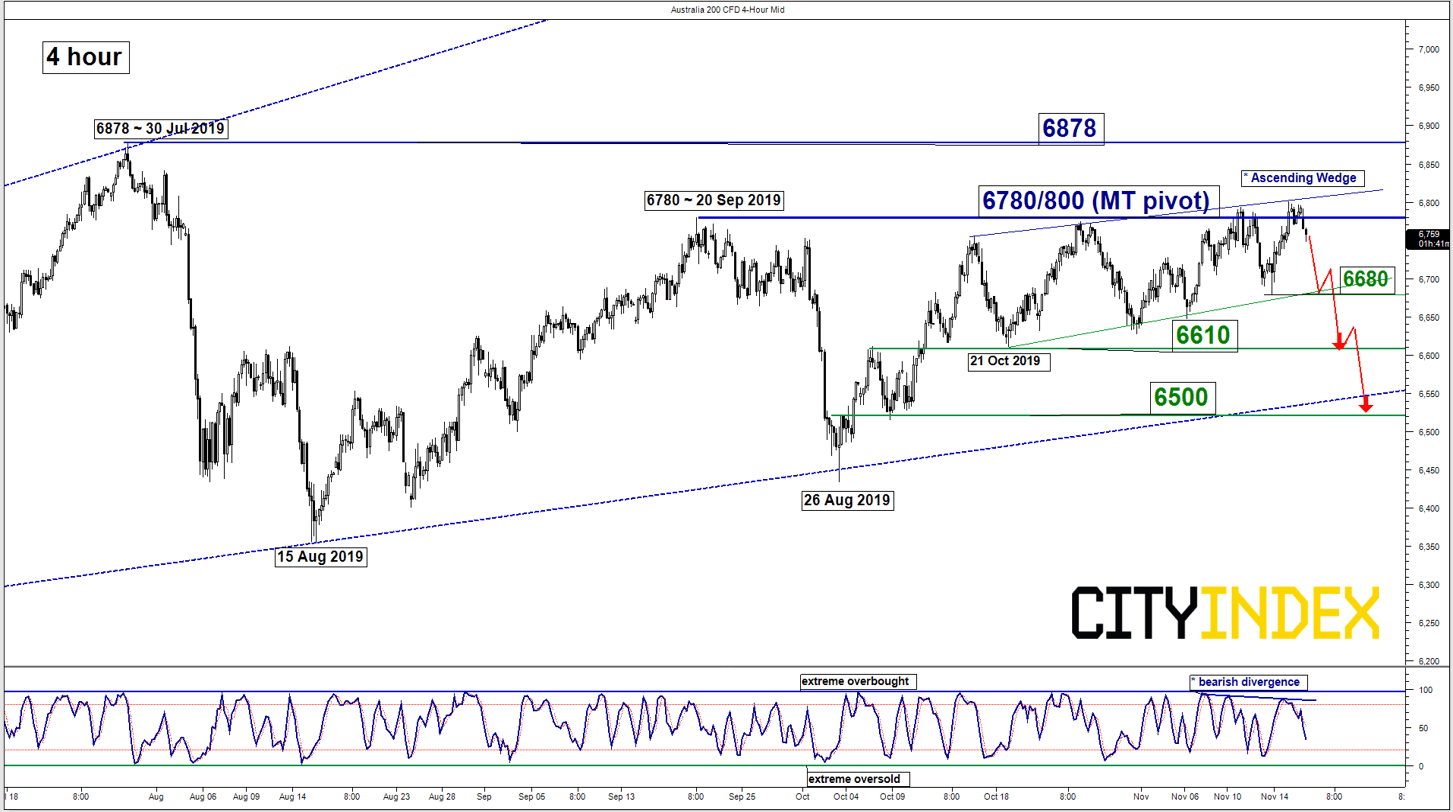
Key Levels (1 to 3 weeks)
Pivot (key resistance): 6780/800
Supports: 6680, 6610 & 6500
Next resistance: 6878
Directional Bias (1 to 3 weeks)
Last week, the Australia 200 (proxy for the ASX 200 futures) has staged a challenge on the 6780 key medium-term pivotal resistance (printed a high of 6801 on last Fri, 15 Nov) before it reversed back below 6780 in today, 18 Nov Asian session.
Elements are not convincing in order to validate a bullish scenario at this juncture, thus tolerate the excess and maintain the bearish bias below 6800 pivotal resistance. A break below 6680 reinforces a further potential drop towards the next support at 6610 in the first step.
However, a daily close above 6800 invalidates the bearish scenario for a squeeze up to retest the 30 Jul 2019 swing high/all-time high area of 6878.
Key elements
- The daily RSI oscillator is still below a significant corresponding resistance at the 60 level.
- The Index has started to evolve within a minor bearish “Ascending Wedge” range configuration in place since 21 Oct 2019 low with upper boundary/resistance at 6800 and lower boundary/support at 6680.
- The 4-hour Stochastic oscillator has displayed a bearish divergence signal which indicates the recent upside momentum of price action from 14 Nov 2019 low has started to ease.
DAX – 13350 remains the key resistance to watch
click to enlarge charts
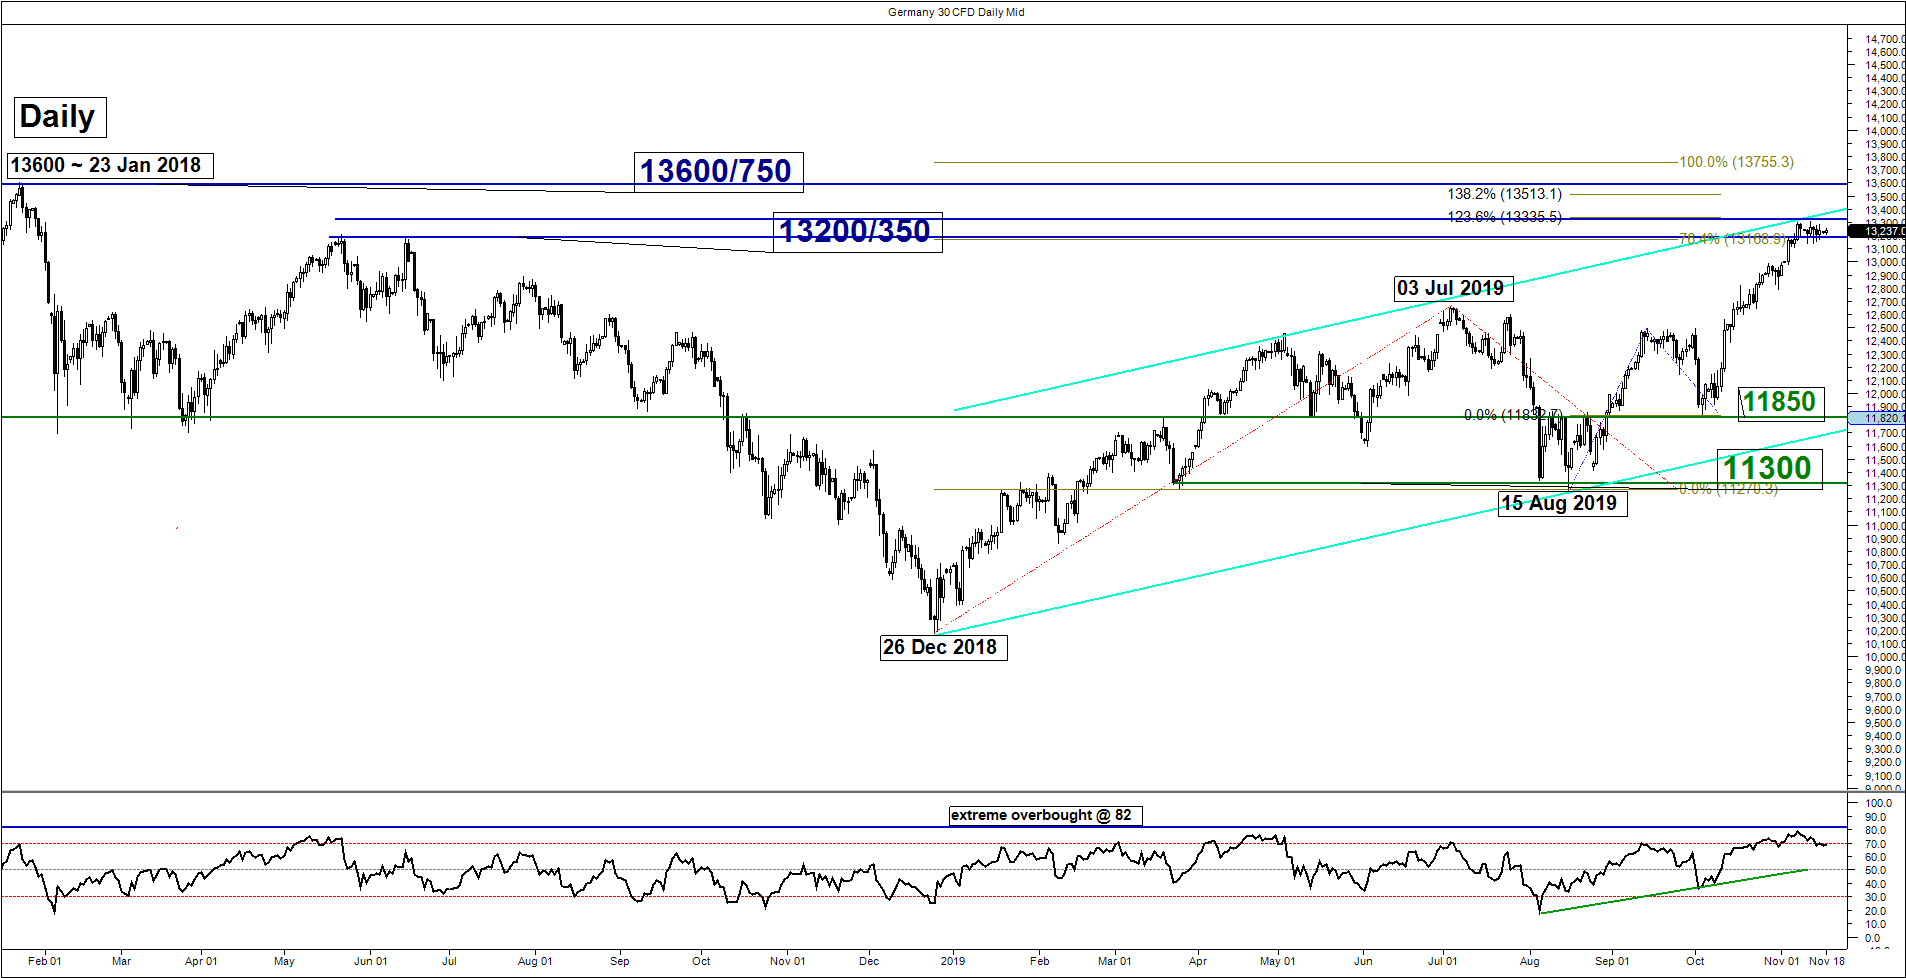
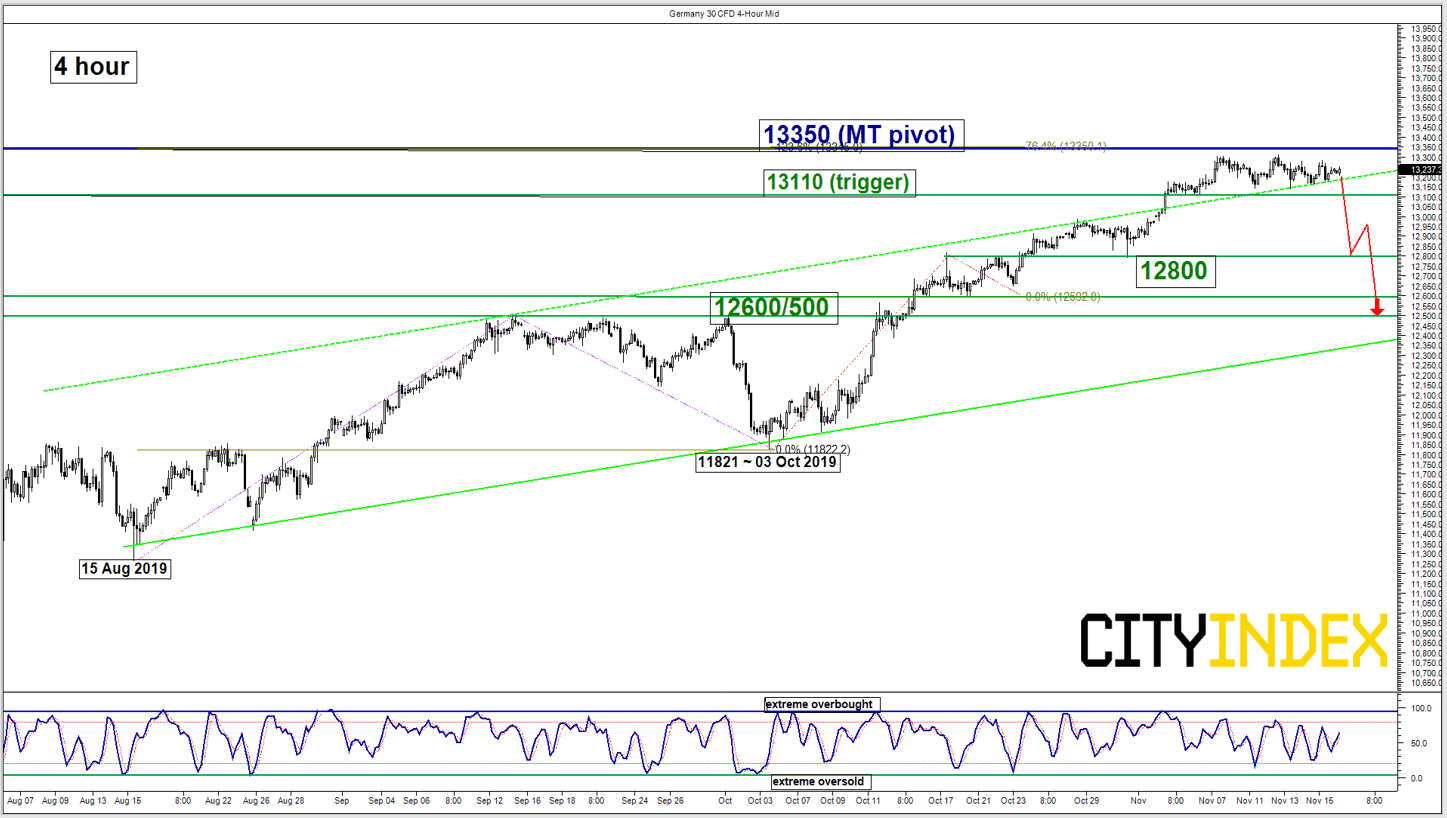
Key Levels (1 to 3 weeks)
Pivot (key resistance): 13200/350 (excess)
Supports: 13110 (trigger), 12800 & 12600/500
Next resistance: 13600 (all-time high)/750
Directional Bias (1 to 3 weeks)
The Germany 30 Index (proxy for the DAX futures) has traded sideways below the 13350 key medium-term pivotal resistance as per highlighted in our previous report.
No change in key elements; maintain bearish bias and a break below the 13110 downside trigger level is required to reinforce the start of a potential corrective decline to target the next supports at 12800 and 12600/500.
However, a clearance with a daily close above 13350 invalidates the bearish scenario for an extension of the up move to retest the current all-time high level of 13600/750 (Fibonacci expansion cluster).
Charts are from City Index Advantage TraderPro & eSignal
StoneX Financial Ltd (trading as “City Index”) is an execution-only service provider. This material, whether or not it states any opinions, is for general information purposes only and it does not take into account your personal circumstances or objectives. This material has been prepared using the thoughts and opinions of the author and these may change. However, City Index does not plan to provide further updates to any material once published and it is not under any obligation to keep this material up to date. This material is short term in nature and may only relate to facts and circumstances existing at a specific time or day. Nothing in this material is (or should be considered to be) financial, investment, legal, tax or other advice and no reliance should be placed on it.
No opinion given in this material constitutes a recommendation by City Index or the author that any particular investment, security, transaction or investment strategy is suitable for any specific person. The material has not been prepared in accordance with legal requirements designed to promote the independence of investment research. Although City Index is not specifically prevented from dealing before providing this material, City Index does not seek to take advantage of the material prior to its dissemination. This material is not intended for distribution to, or use by, any person in any country or jurisdiction where such distribution or use would be contrary to local law or regulation.
For further details see our full non-independent research disclaimer and quarterly summary.
CFDs are complex instruments and come with a high risk of losing money rapidly due to leverage. 69% of retail investor accounts lose money when trading CFDs with this provider. You should consider whether you understand how CFDs work and whether you can afford to take the high risk of losing your money. CFD and Forex Trading are leveraged products and your capital is at risk. They may not be suitable for everyone. Please ensure you fully understand the risks involved by reading our full risk warning.
City Index is a trading name of StoneX Financial Ltd. Head and Registered Office: 1st Floor, Moor House, 120 London Wall, London, EC2Y 5ET. StoneX Financial Ltd is a company registered in England and Wales, number: 05616586. Authorised and regulated by the Financial Conduct Authority. FCA Register Number: 446717.
City Index is a trademark of StoneX Financial Ltd.
The information on this website is not targeted at the general public of any particular country. It is not intended for distribution to residents in any country where such distribution or use would contravene any local law or regulatory requirement.
© City Index 2024