Special Focus Scotland Independence Referendum 8211 A 8220 tug of war 8221
Author: Kelvin Wong, City Index Asia Chief Technical Strategist
18th September 2014, Thursday will be a watershed day for the European continent and United Kingdom. The Scots will go to the polls to decide whether Scotland can be an independent country. A “Yes” vote will put an end to a 307 year-old union between England and Scotland and create Europe’s newest state since the disintegration of Yugoslavia in the 1990s.
Most importantly in the near term, this historical event is likely to have a significant impact on the financial markets. In a previous survey conducted by YouGov has shown a surge in support for Scottish independence which lead to a plunge of the GBP/USD to a five-month low of 1.6060. Even the International Monetary Fund (IMF) has warned that a vote in favour of independence in Scotland could spook the financial markets.
How does this key historical event going to impact the stock market in United Kingdom (UK) and the currency market? Let’s us take a look at the charts of the benchmark UK FTSE 100 Index and the GBP/USD exchange rate to offer some “clues” from a technical analysis perspective.
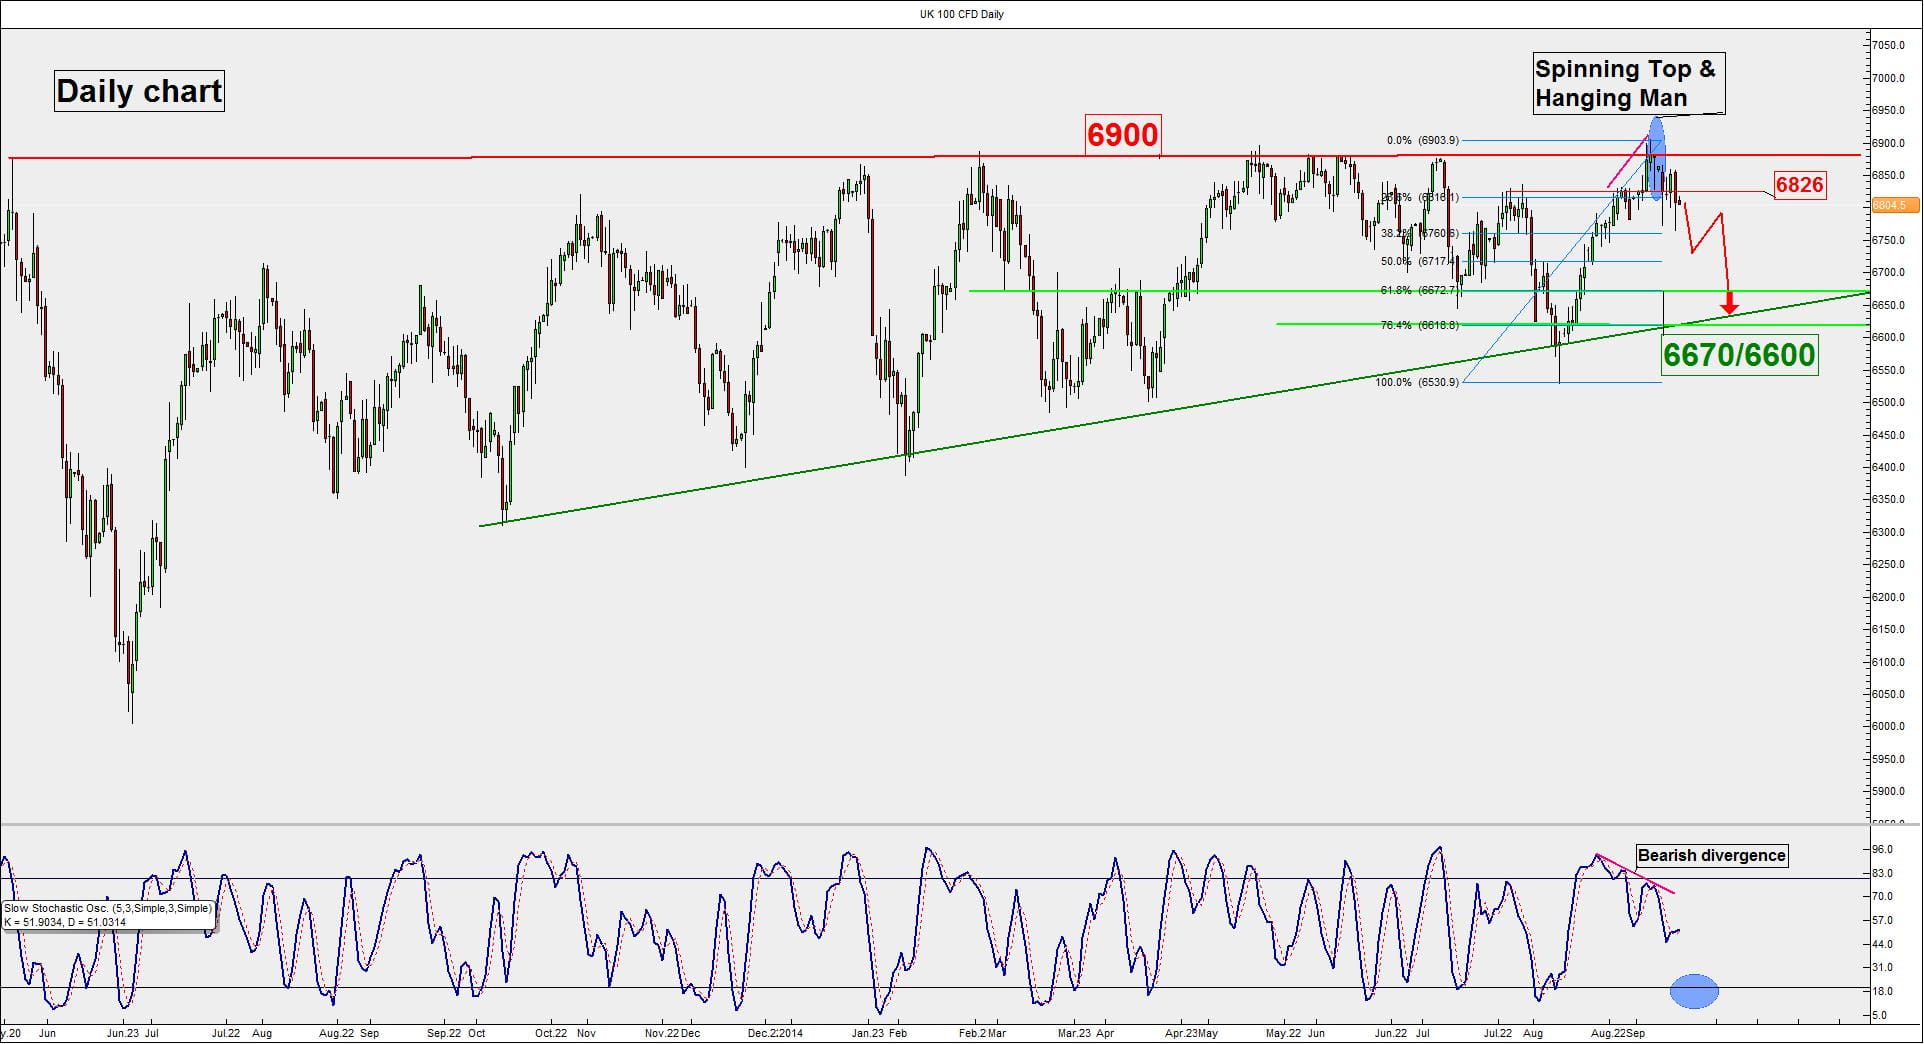
FTSE 100 – Potential weakness ahead before new rise
Key elements
- Since hitting a low close to 6000 on 23 June 2013, the FTSE 100 has been trading in a sideways environment below the 6900 horizontal resistance which is also close to its current all-time high of 6930 achieved in December 1999 (see weekly chart).
- This one year-long plus of sideways movement has formed an impending bullish continuation chart pattern called “Ascending Triangle” (see weekly chart).
- The trendline support of the “Ascending Triangle” stands at 6600 which also coincides with lower boundary of the long-term ascending channel in place since 07 August 2011 and 76.4% Fibonacci retracement from 08 August 2014 low (see weekly & daily charts).
- The upside exit potential of the “Ascending Triangle” stands at 7600 which also confluences closely with the upper boundary of the long-term ascending channel and 0.618 Fibonacci projection from 28 August 2011 low to 23 June 2013 low at 7400 (see weekly chart).
- Price action has shown signs of “weariness” at the 6900 resistance through the formation of the “Spinning Top” and “Hanging Man” bearish candlestick patterns and the Index has recorded a daily close below the low of the “Hanging Man” at 6826 (see daily chart).
- The Stochastic oscillator has flashed a bearish divergence signal and still has room for further downside potential towards its oversold region (see daily chart).
Key levels (1 to 3 months)
Pivot (key resistance): 6900/6930
Support: 6670/6600
Next resistance: 7400/7600
Conclusion
The longer-term picture (weekly chart) suggests that the FTSE 100 is still evolving within a bullish trend since 2011. A clear break above the 6900 resistance of the impending “Ascending Triangle” is likely to trigger a new round of potential upside movement towards the 7400/7600 zone.
However in the intermediate term (1 to 3 weeks), the Index may see a decline below the 6900/6930 pivotal resistance to test the trendline support of the “Ascending Triangle” at the 6670/6600 zone.
*GBP/USD – Still below 1.6300 key resistance
The GBP/USD pair (daily chart) dropped last week to nearly a ten-month low of 1.6050, as well as a low for 2014, after an extreme plummet that gapped down below previous major support around the 1.6300 level.
The steep decline of the past two months that signaled the potential beginnings of a new bearish trend began in earnest after the retreat from the mid-July multi-year high of 1.7190.
After that retreat, the current two-month decline broke down below several major support levels, including 1.7000, 1.6700, 1.6500, and most recently, the noted 1.6300 level, a major historical support and resistance level. In the process of this plunge, price action also broke down swiftly below both the key 50-day and 200-day moving averages.
The 50-day moving average has recently crossed decisively below the 200-day moving average, a major bearish technical event that has not occurred since February of 2013.
After declining to the noted 1.6050 low last week, price action rebounded significantly to approach the noted 1.6300 level once again, this time as resistance. As of Monday, however, the currency pair has retreated slightly, unable to breakout above 1.6300.
Conclusion
If GBP/USD continues to trade below 1.6300, this week’s event risk could push the pair towards its next major downside support target around the key 1.6000 psychological support level, followed closely to the downside by the 1.5900 and then 1.5750 support targets.
In the event of any significant breakout above 1.6300 resistance, further major resistance to the upside resides around the 1.6500 level.
* Contributed by James Chen, Chief Technical Strategist, City Index Group
Charts are from City Index Advantage Trader and MT4
StoneX Financial Ltd (trading as “City Index”) is an execution-only service provider. This material, whether or not it states any opinions, is for general information purposes only and it does not take into account your personal circumstances or objectives. This material has been prepared using the thoughts and opinions of the author and these may change. However, City Index does not plan to provide further updates to any material once published and it is not under any obligation to keep this material up to date. This material is short term in nature and may only relate to facts and circumstances existing at a specific time or day. Nothing in this material is (or should be considered to be) financial, investment, legal, tax or other advice and no reliance should be placed on it.
No opinion given in this material constitutes a recommendation by City Index or the author that any particular investment, security, transaction or investment strategy is suitable for any specific person. The material has not been prepared in accordance with legal requirements designed to promote the independence of investment research. Although City Index is not specifically prevented from dealing before providing this material, City Index does not seek to take advantage of the material prior to its dissemination. This material is not intended for distribution to, or use by, any person in any country or jurisdiction where such distribution or use would be contrary to local law or regulation.
For further details see our full non-independent research disclaimer and quarterly summary.
CFDs are complex instruments and come with a high risk of losing money rapidly due to leverage. 69% of retail investor accounts lose money when trading CFDs with this provider. You should consider whether you understand how CFDs work and whether you can afford to take the high risk of losing your money. CFD and Forex Trading are leveraged products and your capital is at risk. They may not be suitable for everyone. Please ensure you fully understand the risks involved by reading our full risk warning.
City Index is a trading name of StoneX Financial Ltd. Head and Registered Office: 1st Floor, Moor House, 120 London Wall, London, EC2Y 5ET. StoneX Financial Ltd is a company registered in England and Wales, number: 05616586. Authorised and regulated by the Financial Conduct Authority. FCA Register Number: 446717.
City Index is a trademark of StoneX Financial Ltd.
The information on this website is not targeted at the general public of any particular country. It is not intended for distribution to residents in any country where such distribution or use would contravene any local law or regulatory requirement.
© City Index 2024