SP500 what comes next
A continued recovery in U.S. equity markets overnight prompted by headlines that a research team at a Chinese university had found an effective drug to treat patients of coronavirus and another round of better than expected U.S. economic data.
In terms of the U.S. economic data, the ADP employment print was notable for being the strongest number since May 2015 and was followed by better than expected ISM non-manufacturing PMI data coming hot on the heels of stronger than expected ISM manufacturing number released earlier in the week.
In our articles on key stock indices over the course of the past two weeks, our base case has been for a pullback of between 3-5% in key equity markets including the S&P 500 and the ASX200, the emergence of the virus being the catalyst for the corrections.
The strong rebound in both the S&P500 and the ASX 200 comes following falls of -3.7% and -3.5% respectively, right in the ballpark of what we looking for, a pleasing development as an analyst and a trader, a tragedy that it comes as a result of the loss of human life.
Taking into careful consideration that uncertainties remain around the duration and severity of the coronavirus, we will attempt to answer what comes next for the benchmark S&P 500 equity index, the barometer of risk sentiment that I most rely on.
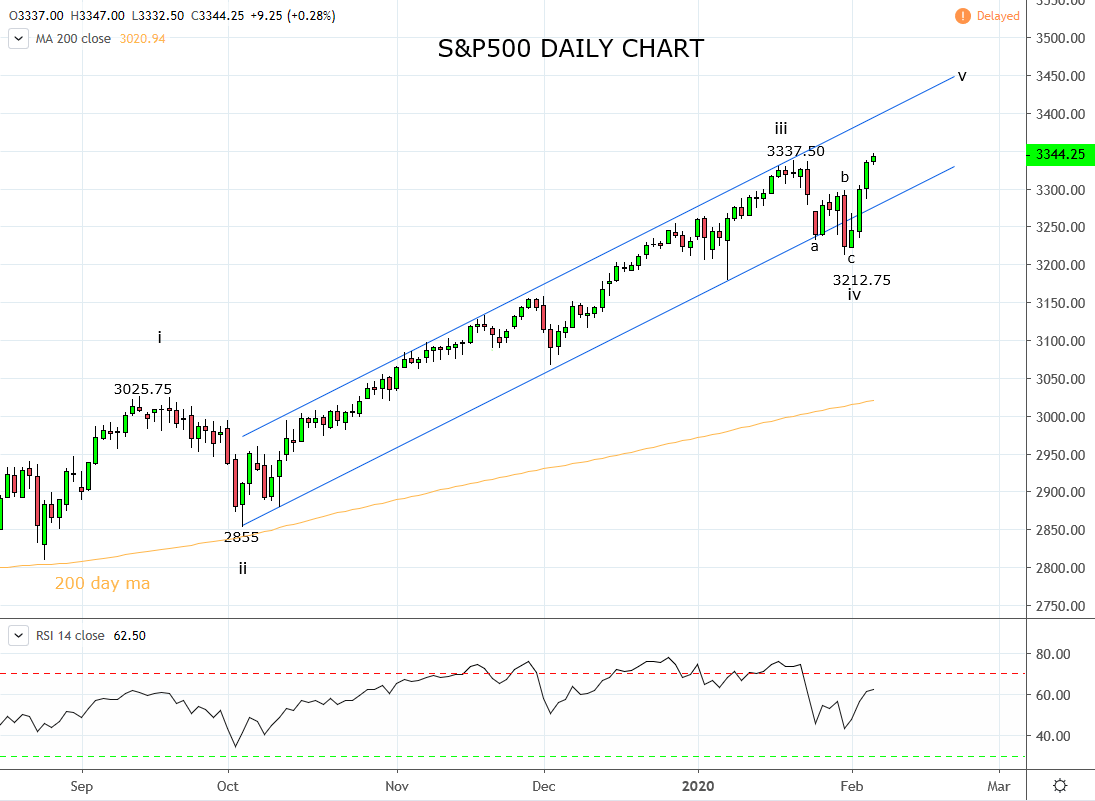
As viewed on the chart below, the decline from the 3337.50 high to this week’s 3212.75 low, while falling just short of our ideal pullback target between 3200 and 3180 unfolded in three waves, typically a sign of a correction, before returning to the surety of a well establish uptrend channel.
Today in the Asian session, S&P 500 futures have made new all-time highs, in theory, the minimum requirement for a Wave v. However, if we use a common projection for a Wave v which is the length of Wave i, there is scope for the next leg higher to extend towards 3450/3500.
In a nutshell, the recent correction appears complete and the 3450/3500 area becomes the next upside target, using this week's 3212.75 swing low as the bullish reassessment level.
Source Tradingview. The figures stated areas of the 6th of February 2020. Past performance is not a reliable indicator of future performance. This report does not contain and is not to be taken as containing any financial product advice or financial product recommendation
StoneX Financial Ltd (trading as “City Index”) is an execution-only service provider. This material, whether or not it states any opinions, is for general information purposes only and it does not take into account your personal circumstances or objectives. This material has been prepared using the thoughts and opinions of the author and these may change. However, City Index does not plan to provide further updates to any material once published and it is not under any obligation to keep this material up to date. This material is short term in nature and may only relate to facts and circumstances existing at a specific time or day. Nothing in this material is (or should be considered to be) financial, investment, legal, tax or other advice and no reliance should be placed on it.
No opinion given in this material constitutes a recommendation by City Index or the author that any particular investment, security, transaction or investment strategy is suitable for any specific person. The material has not been prepared in accordance with legal requirements designed to promote the independence of investment research. Although City Index is not specifically prevented from dealing before providing this material, City Index does not seek to take advantage of the material prior to its dissemination. This material is not intended for distribution to, or use by, any person in any country or jurisdiction where such distribution or use would be contrary to local law or regulation.
For further details see our full non-independent research disclaimer and quarterly summary.
CFDs are complex instruments and come with a high risk of losing money rapidly due to leverage. 69% of retail investor accounts lose money when trading CFDs with this provider. You should consider whether you understand how CFDs work and whether you can afford to take the high risk of losing your money. CFD and Forex Trading are leveraged products and your capital is at risk. They may not be suitable for everyone. Please ensure you fully understand the risks involved by reading our full risk warning.
City Index is a trading name of StoneX Financial Ltd. Head and Registered Office: 1st Floor, Moor House, 120 London Wall, London, EC2Y 5ET. StoneX Financial Ltd is a company registered in England and Wales, number: 05616586. Authorised and regulated by the Financial Conduct Authority. FCA Register Number: 446717.
City Index is a trademark of StoneX Financial Ltd.
The information on this website is not targeted at the general public of any particular country. It is not intended for distribution to residents in any country where such distribution or use would contravene any local law or regulatory requirement.
© City Index 2024