SP500 The Long Short Of It SPX SYS ORLY EBAY TXN
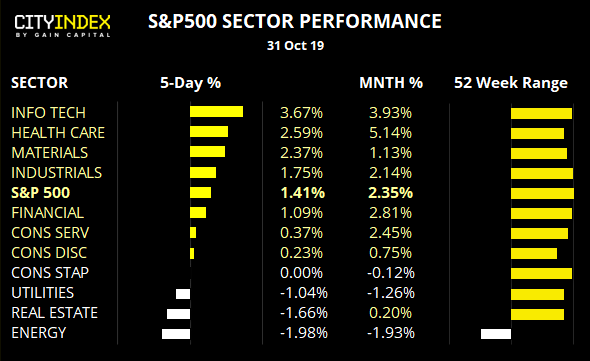
The S&P500 closed to new highs following yesterday’s Fed meeting, supported by higher earnings whilst also taking comfort from Powell’s comments that a hike is unlikely. Technically, it rests on the pivotal level of 3028, yet resistance nearby awaits. A break above the Jan 2018 resistance level assume bullish trend continuation, whereas a break back beneath 3028 warns of a bull-trap and deeper correction.
Flicking through equities for the S&P500 showed greater potential for short setups than longs. Perhaps that’s a bad omen for new highs on S&P500, although part of the reason many longs were rejected were because they were either too close to earnings or overextended without any signs of a pullback.
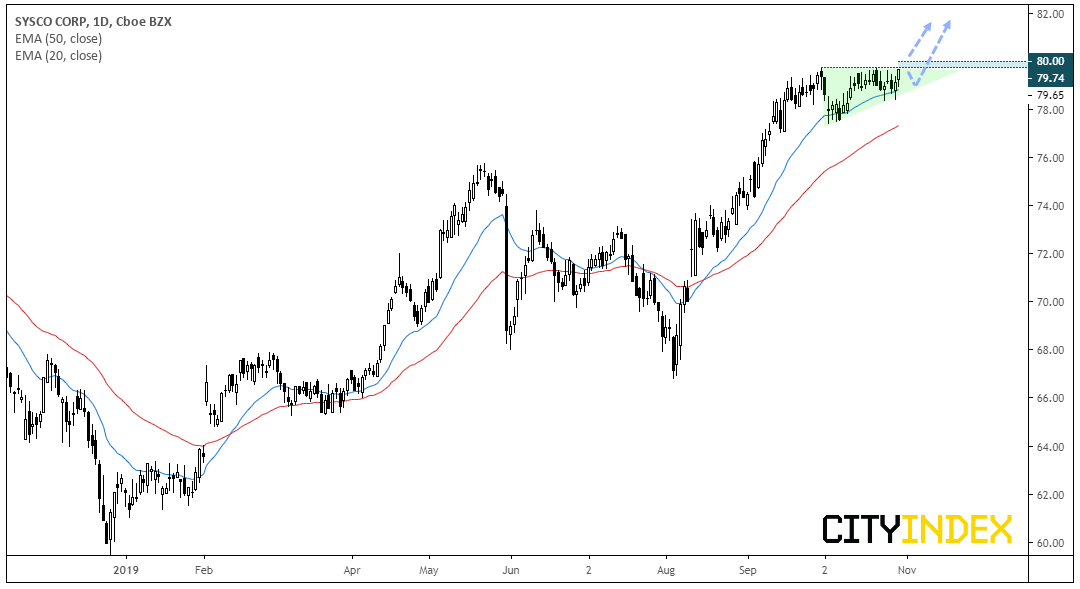
Sysco Corp CFD/DFT: Trading just off its all-time highs, prices have had a chance to consolidate below 80 which has provided adequate mean reversion for a potential long setup. The recent higher low has respected the 20-day average and it appears that prices could just as easily break higher as it could produce another higher low to form a potential ascending triangle.
Keep I mind that earnings are on the 4th November, where a notable earnings mis could topple this from its highs. Hopefully though, they’ll be supportive of this compelling setup.
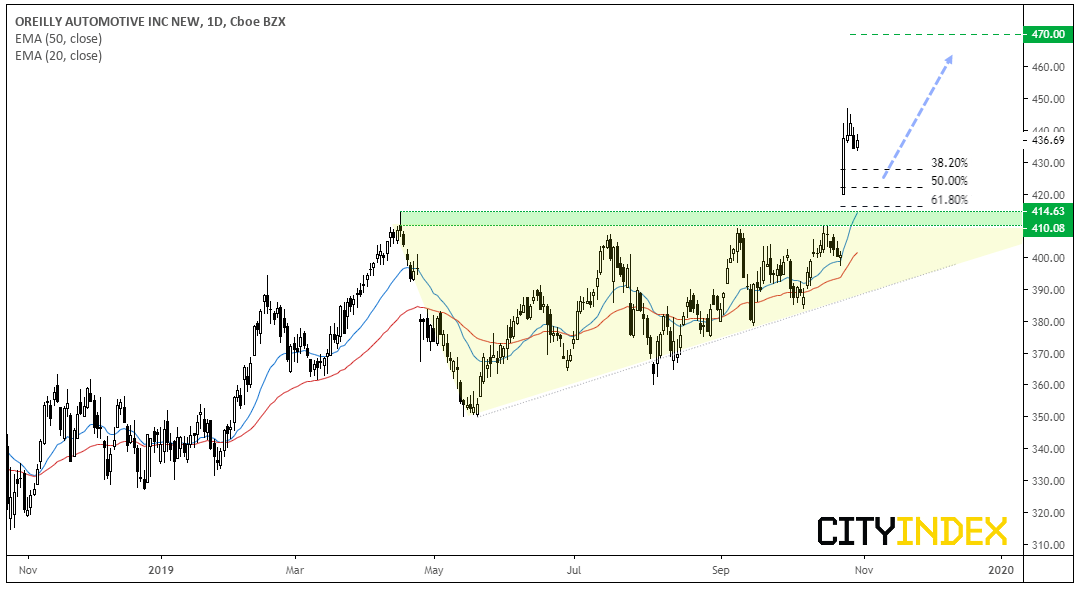
O'Reilly Automotive Inc CFD/DFT: Positive earnings saw this explode higher out of an ascending triangle and found resistance around the monthly R3 pivot (not pictured for a cleaner chart). A hammer at the highs showed prices were exhausted and now a retracement is underway. This may be a little premature for the watchlist, but it’s worthy keeping an eye on none the less given the strength of the breakout.
With little in the way of support above 410-415, traders can see if prices stabilise around a Fibonacci level. If satisfied a higher low has formed, a volatility such as ATR can be used to calculate the ‘invalidation point’ of the bullish bias. Bullish swing traders could then look to enter, or for a more conservative approach, wait for signs bullish momentum has returned to provide greater confidence the low is in.
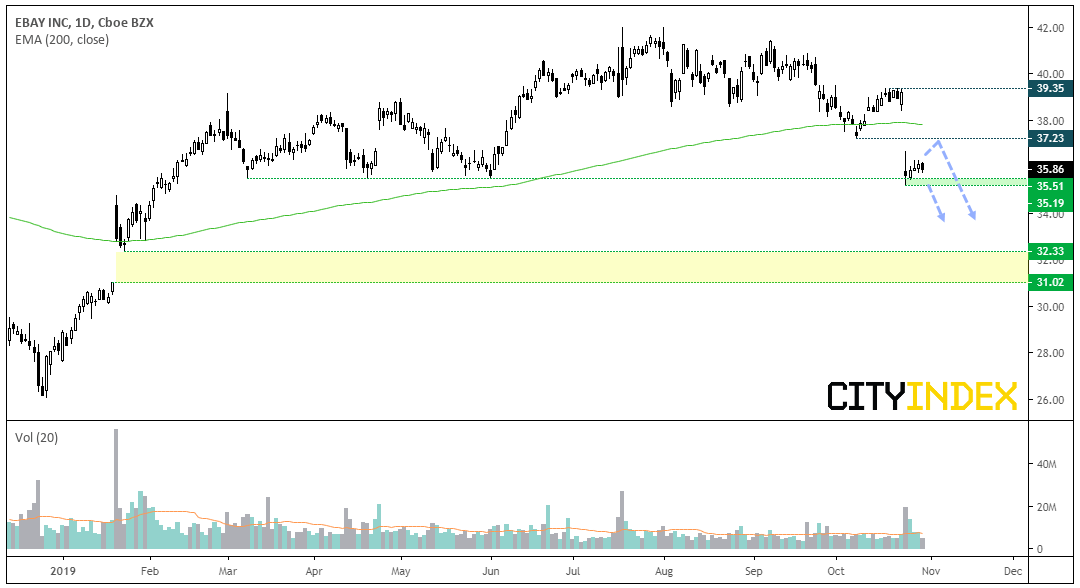
Ebay CFD/DFT: Long known for its discounts, Ebay’s stock price also found itself on sale following poor earnings last week. Thursday’s large gap lower saw it plummet through the 200-day eMA and now prices are clinging onto key support around $35. The fact it has failed to provide any meaningful rally despite the S&P500 hitting new highs is telling, as is the declining volume during this week’s lacklustre ‘rebound’.
- Bias is for a break to new lows and for prices to target the upside gap around 32.33.
- Bears can either wait for a break below 35.00/35.19, or fade into rallies below 37.23.
- If the trend takes off then bears could look to ‘close’ the gap around 31 and take it south.
- A break above 37.23 places it onto the backburner, although it still leaves potential for a large rounding top pattern to develop over the coming weeks if it remains below 39.35
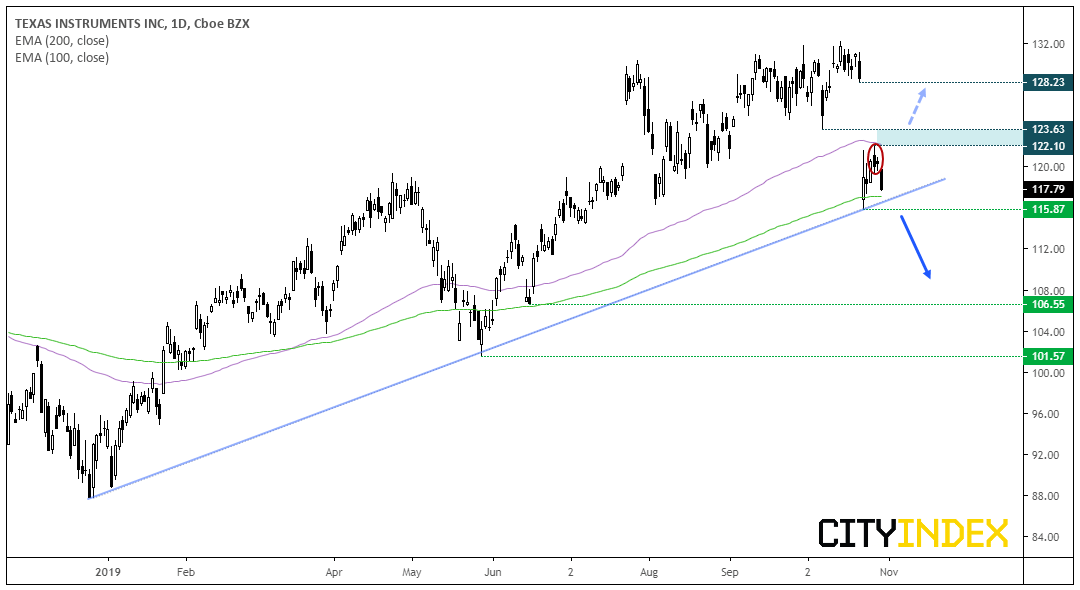
Texas Instruments CFD/DFT: The gap lower last week took prices straight down to the bullish trendline and 200-day eMA. So, we’re at another juncture where bulls either save the day and keep prices above these levels, or the dead cat has bounced and we’re waiting for a break lower.
Given the magnitude of the gap from its highs (a breakaway gap) and that the pullback from the trendline has found resistance below the 100-day average, the bias is for a break lower.
- Bias remains bearish below 122.10
- Bears can wait for a break below the 200-eMA and bullish trendline. A more cautious approach is to wait for a break beneath 115.87.
- A break above 122.10 also breaks the 100-day eMA. Bulls could look to close the gap towards 128.23, although 126.63 could provide interim resistance.
Related analysis:
FTSE: The Long And Short Of It | FTSE, AVST, BA, GRG
S&P500: Long and Short of It | S&P, Starbucks, Assurance
StoneX Financial Ltd (trading as “City Index”) is an execution-only service provider. This material, whether or not it states any opinions, is for general information purposes only and it does not take into account your personal circumstances or objectives. This material has been prepared using the thoughts and opinions of the author and these may change. However, City Index does not plan to provide further updates to any material once published and it is not under any obligation to keep this material up to date. This material is short term in nature and may only relate to facts and circumstances existing at a specific time or day. Nothing in this material is (or should be considered to be) financial, investment, legal, tax or other advice and no reliance should be placed on it.
No opinion given in this material constitutes a recommendation by City Index or the author that any particular investment, security, transaction or investment strategy is suitable for any specific person. The material has not been prepared in accordance with legal requirements designed to promote the independence of investment research. Although City Index is not specifically prevented from dealing before providing this material, City Index does not seek to take advantage of the material prior to its dissemination. This material is not intended for distribution to, or use by, any person in any country or jurisdiction where such distribution or use would be contrary to local law or regulation.
For further details see our full non-independent research disclaimer and quarterly summary.
CFDs are complex instruments and come with a high risk of losing money rapidly due to leverage. 69% of retail investor accounts lose money when trading CFDs with this provider. You should consider whether you understand how CFDs work and whether you can afford to take the high risk of losing your money. CFD and Forex Trading are leveraged products and your capital is at risk. They may not be suitable for everyone. Please ensure you fully understand the risks involved by reading our full risk warning.
City Index is a trading name of StoneX Financial Ltd. Head and Registered Office: 1st Floor, Moor House, 120 London Wall, London, EC2Y 5ET. StoneX Financial Ltd is a company registered in England and Wales, number: 05616586. Authorised and regulated by the Financial Conduct Authority. FCA Register Number: 446717.
City Index is a trademark of StoneX Financial Ltd.
The information on this website is not targeted at the general public of any particular country. It is not intended for distribution to residents in any country where such distribution or use would contravene any local law or regulatory requirement.
© City Index 2024