SP500 The Long and Short Of It Mastercard NextEra Energ McDonalds
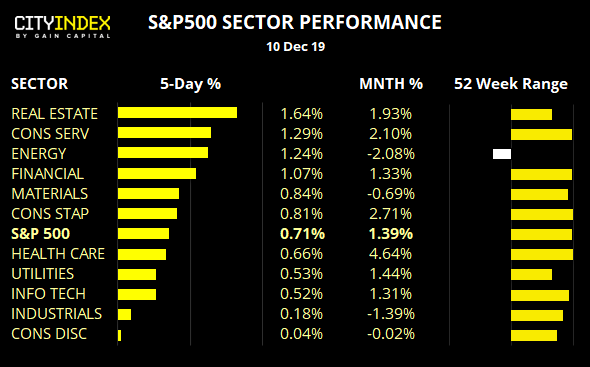
- Spanning 3 sessions, the S&P500’s pullback from its highs was short-lived, yet by its own standards quite deep at -2.7%. Still, support was found at 3065 and prices are now consolidating just below record highs once more. Unless Trump unveils tariffs on China over the weekend, we’d expect it to break to new highs. Yet we doubt he’ll want to knock equities from their perch heading into the new year, so perhaps they’ll be delayed again anyway.
- All sectors have remained in the black over the past five session, with real estate, consumer services and even energy leading the way.
- 6 out of the 11 sectors trade just off record highs, which underscores the strength of this bullish trend.
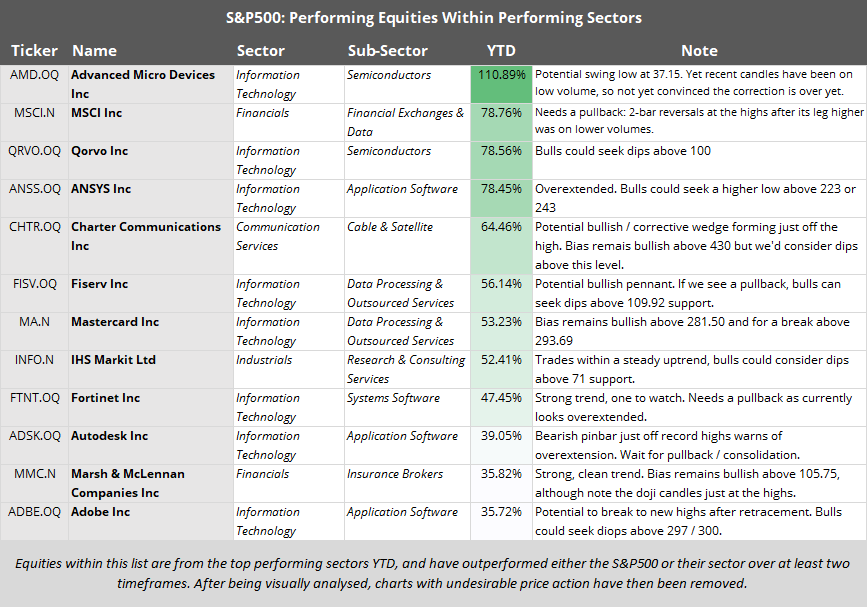
- With the index poised to break to new highs (sooner or later) then the relative strength watchlist will focus on outperforming stocks for now.
- Chart below also include ideas that are on price action only, so may not factor in whether it’s in an outperforming/underperforming sector.
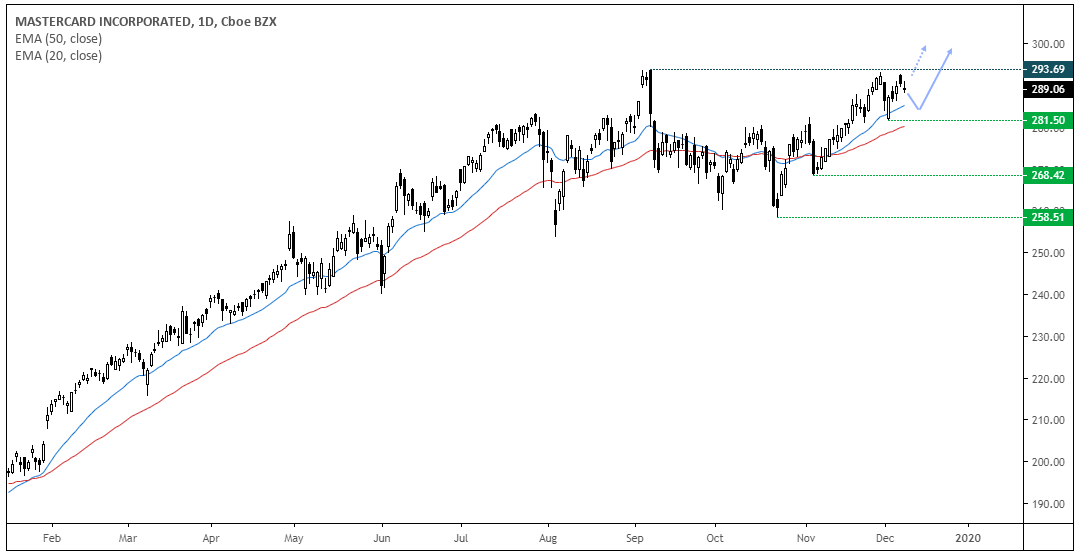
Mastercard CFD/DFT (MA): Trading just off record highs amid a multi-year bull run, Mastercard could be poised for another bullish breakout. A tall bullish candle marks a likely swing low at 281.50, which found support between the 20 and 50-day eMA. Whilst thinner volumes over recent sessions warn the breakout may not be immediate, given the strength of the trend from the 258.51 low, an eventual break higher is favoured.
- Bias remains bullish above 281.50
- Bulls can wait for a break above 293.69 or seek to buy dips above 281.50 if confident we’ll eventually see a break to new highs.
- A break below 281.50 warns of a wider sideways correction between 258.51 – 293.69, which could suit counter-trend traders until bullish momentum returns.
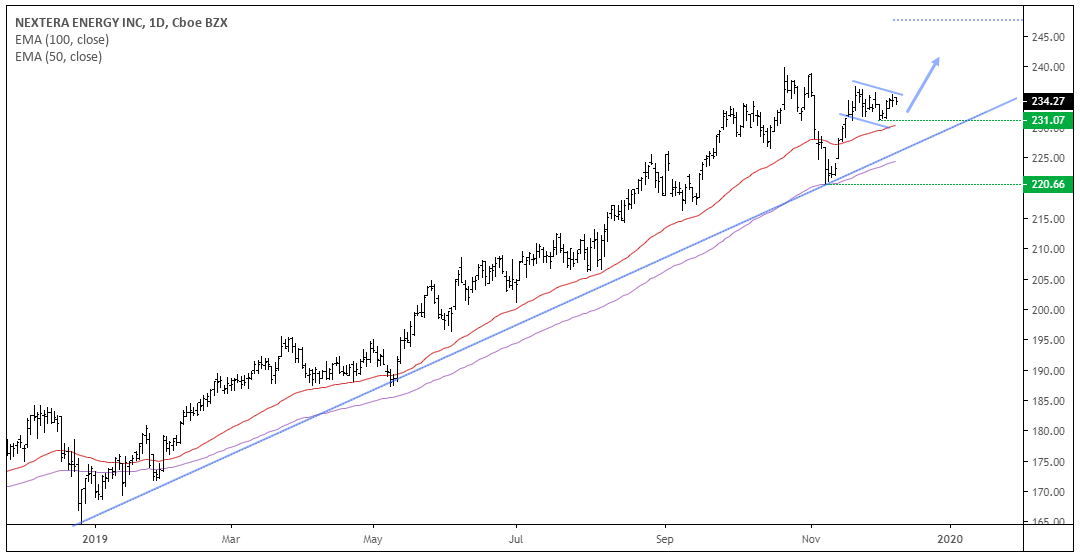
NextEra Energy Inc CFD/DFT (NEE): Its parabolic trend continues (zoon out to see the chart from the 1990’s and you’ll see what we mean) and price action is considering a break to new highs. Having rebounded from 220 support at the trendline, price action is now carving out a bullish flag which, if successful, projects a target around 248.
- Bias remains bullish above the trendline, although we’d prefer to see 231 hold as support to assume a bullish flag remains in play.
- Traders can either wait for a break of the bull flag or, if confident it could revert to its trend, enter during the consolidation period.
- As it’s a long-term bullish trend, an upside target could remain open. Although the bull-flag target around 248 could also be considered.
McDonald's Corp CFD/DFT: As much as we love them, we’re bearish on burgers whilst McDonalds remains below 200. Having carved out a top pattern between June through October, prices gapped topped proceeded to trade below the projected target around 190. The 50-day eMA ha crossed below the 200-day eMA, both of which are capping as resistance around the 38.2% Fibonacci level and the round number 200. Prices are now consolidating below a cluster of resistance around 200, so we’re waiting for this to break lower or complete its correction beneath the bearish trendline.
- Bias remains bearish beneath the resistance cluster around 200
- Whilst this could morph into a bearish triangle, it could just as easily pull back towards the trendline / resistance cluster before topping out. Therefore, a wider stop is something to consider to allow ‘breathing room’ around the position.
- Initial target is the 187.55 low and then 180.
Price Action Update:
- Advanced Micro Device CFD/DFT: After gapping lower through support then breaking higher, it would have been difficult to gain a decent entry. This is on the backburner until the picture becomes clearer (although give its longer-term uptrend, we’ll continue to monitor its potential for a trough)
- United Technologies CFD/DFT: The bias for a pullback has played out, albeit a little deeper than anticipated as it dipped beneath 144.35 support. Yet support has been found at the 50-day eMA and the bearish days were on lower volume to suggest the declines were indeed a correction. Bulls could either wait for a break above 149.81 or a consider a break of a bearish channel. Ultimately, we’d prefer to at least see a bullish candle on the daily as, for far, each candle has been bearish.
- Apache Corp CFD/DFT: Due to the large gap down at the open, one would have to have already been ‘in it to win it’. So whilst the directional bias was correct, the gap was unfortunate. It remains on the bearish watchlist for another entry, so perhaps bears could consider fading into minor rallies below 22.19 with view for it to break to new lows.
- Nisource CFD/DFT: The bias remains bearish although retracement from its lows has recycled higher, leaving a potential ABC correction to monitor (and as volumes on the minor rebound are low it also points towards corrective price action). Whilst too soon so say it has finally completed, yesterday’s bearish candle below 27 resistance (and the 38.2% Fibonacci ratio) are encouraging so bears should keep this on their watchlist for signs of bearish momentum to return.
StoneX Financial Ltd (trading as “City Index”) is an execution-only service provider. This material, whether or not it states any opinions, is for general information purposes only and it does not take into account your personal circumstances or objectives. This material has been prepared using the thoughts and opinions of the author and these may change. However, City Index does not plan to provide further updates to any material once published and it is not under any obligation to keep this material up to date. This material is short term in nature and may only relate to facts and circumstances existing at a specific time or day. Nothing in this material is (or should be considered to be) financial, investment, legal, tax or other advice and no reliance should be placed on it.
No opinion given in this material constitutes a recommendation by City Index or the author that any particular investment, security, transaction or investment strategy is suitable for any specific person. The material has not been prepared in accordance with legal requirements designed to promote the independence of investment research. Although City Index is not specifically prevented from dealing before providing this material, City Index does not seek to take advantage of the material prior to its dissemination. This material is not intended for distribution to, or use by, any person in any country or jurisdiction where such distribution or use would be contrary to local law or regulation.
For further details see our full non-independent research disclaimer and quarterly summary.
CFDs are complex instruments and come with a high risk of losing money rapidly due to leverage. 69% of retail investor accounts lose money when trading CFDs with this provider. You should consider whether you understand how CFDs work and whether you can afford to take the high risk of losing your money. CFD and Forex Trading are leveraged products and your capital is at risk. They may not be suitable for everyone. Please ensure you fully understand the risks involved by reading our full risk warning.
City Index is a trading name of StoneX Financial Ltd. Head and Registered Office: 1st Floor, Moor House, 120 London Wall, London, EC2Y 5ET. StoneX Financial Ltd is a company registered in England and Wales, number: 05616586. Authorised and regulated by the Financial Conduct Authority. FCA Register Number: 446717.
City Index is a trademark of StoneX Financial Ltd.
The information on this website is not targeted at the general public of any particular country. It is not intended for distribution to residents in any country where such distribution or use would contravene any local law or regulatory requirement.
© City Index 2024