SP500 Long and Short of It SBUX AIZ
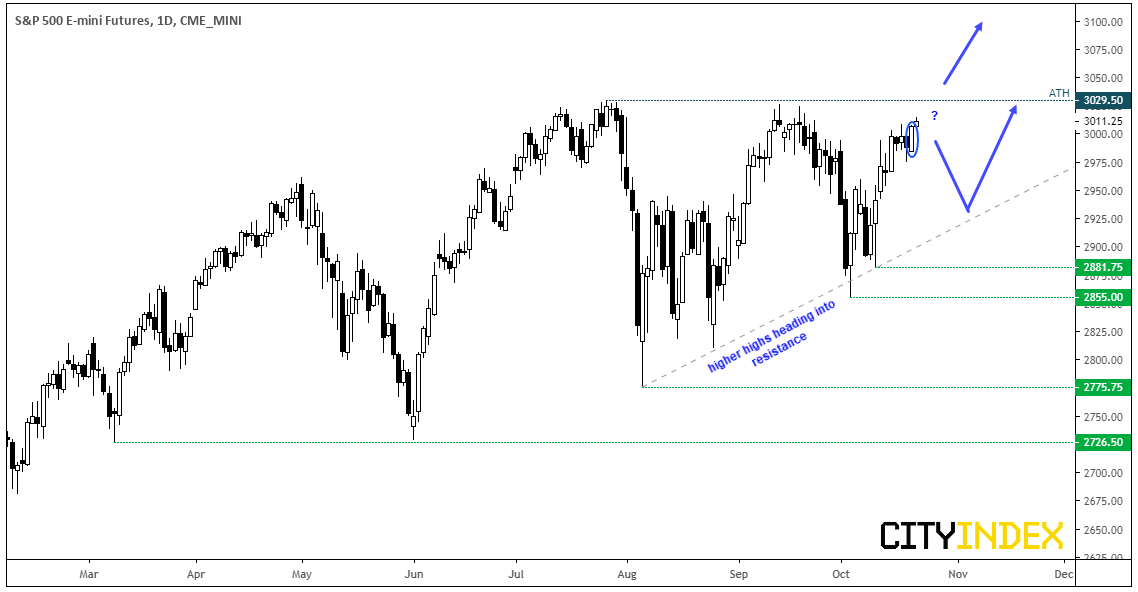
The S&P E-mini closed the session with a bullish engulfing candle yesterday and has broken to an intraday high in Asia, on the back of positive news on the US-China trade negotiations. According to President Trump, China has indicated trade talks are advancing, which raises hopes that a trade deal could be signed in Chile next month.
Still, the &P500 has reported YoY decline in earnings for a third quarter, which is currently -4.7%. Whilst revenues are higher at 2.6%, it points towards as squeeze on net profit margins for Q3. So it’s not all rosy at the highs.
From a technical standpoint, it trades just 19 points from record highs which has bulls on high alert for a fresh breakout. Yet there’s also the potential for this to morph into an ascending triangle, which leaves room for at least another cycle lower (with a higher low or two) before breaking out.
- The reward to risk potential is unappealing for bulls, being so close to the all-time highs, Therefor, they may want to wait for a break above 3029.50 for even a daily close, before assuming a breakout is underway.
- Bears could also consider fading into any minor rally below key resistance. However, keep in mind this is counter to the long-term uptrend so likely carries greater risk.
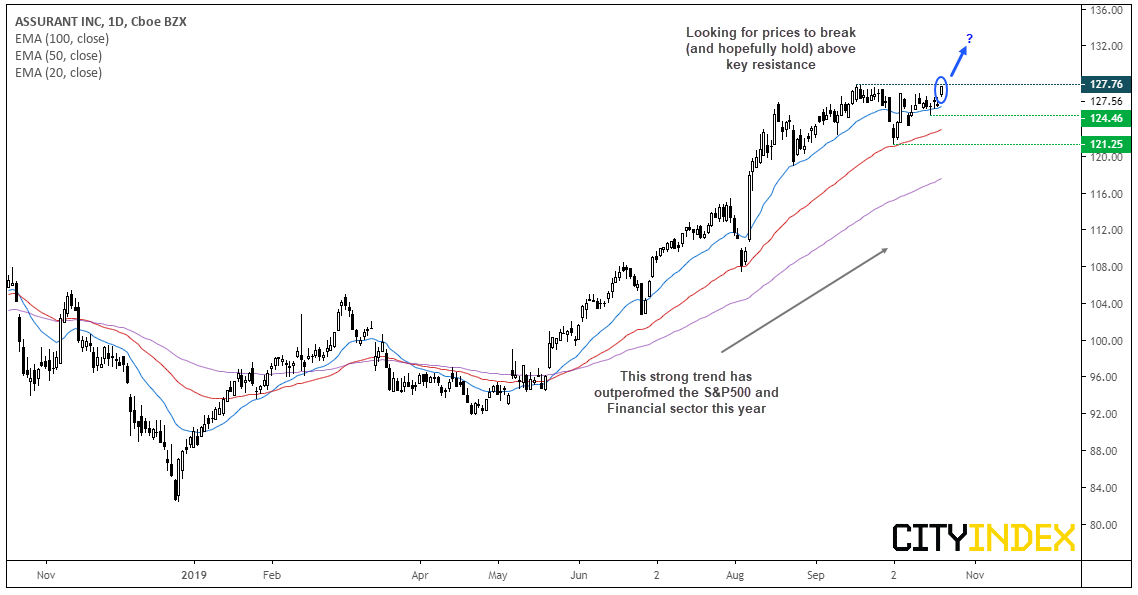
Assurant CFD/DFT: Currently around 25% up for the year, this household insurance company has outperformed both the S&P500 and financial sector. Structurally, the daily trend is clearly bullish and is on the cusp of breaking to a new 52-week high. The 50-day eMA provided support and marks the potential swing low, and yesterday’s gap higher saw it gap out of compression. Given we’ve just seen over a month of consolidation at the highs, there are no clear signs of overextension despite it sitting near its record highs.
- A clear break (and / or close) above 127.76 assumes bullish trend continuation.
- The trend remains bullish above 121.25, although we could also step aside if momentum reverses and breaks beneath the small doji around 124.46
- Being near record highs, traders could use an open target if trading the daily timeframe
- Intraday momentum traders could also monitor this for a break higher, whilst swing traders could wait to see if the 127.76 area holds as support
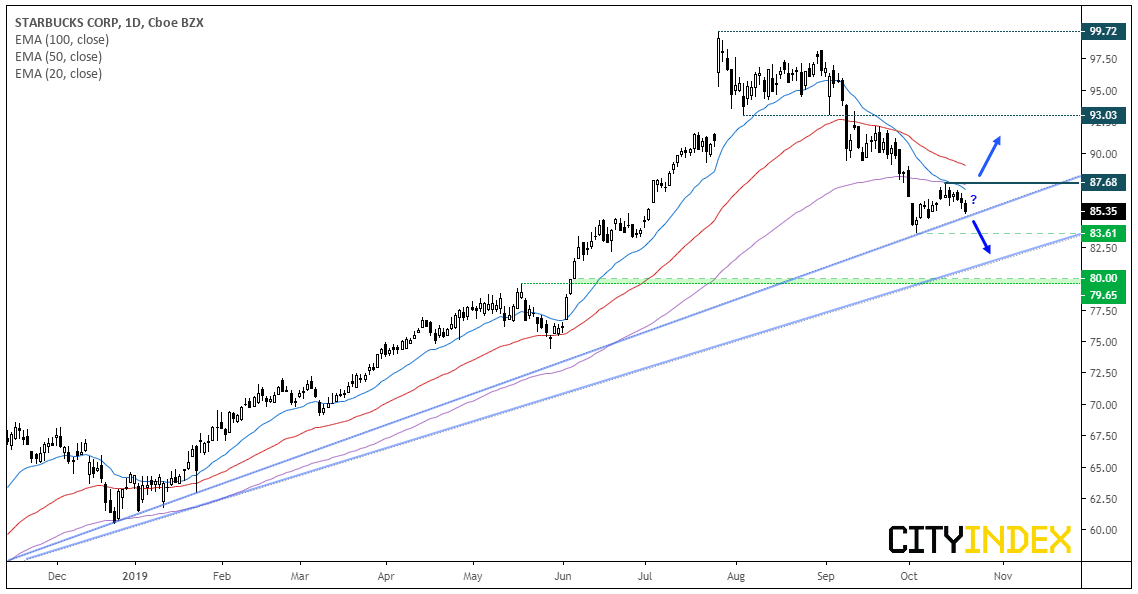
Starbuck Corp CFD/DFT: The price action on SBUX has caught our eye, as it’s at a technical juncture. From June ’18 to July this year, it traded in a very strong, almost parabolic bullish trend. Yet since peaking just below 100, a counter-trend move has unfolded with a series of lower lows and highs and its recent pullback has found resistance at the 100 and 20-day eMA’s. Furthermore, the 20-day eMA has crossed blow the 100 and the 50-day also points lower. Whilst this would be an appealing setup to bearish swing traders, prices have stalled at the September ’18 trendline.
- A break of the Sep ’18 trendline confirms a resumption of the bearish trend from the 2018 high and target the 83.61 low initially, and the June ’18 trendline and the high around 80.
- Bulls could wait to see if the bullish trendline holds and momentum breaks above the 87.68 high. This would also break back above the 20 and 100-eMA’s and create a higher low and higher high.
Price Action Update:
Apple Inc CFD/DFT: After finding support at the prior ATH’s around 233, its closed to fresh new highs and keeps the bullish channels very much alive and well. With no clear signs of a top, the trend points high and could be an equity for intraday momentum traders to also consider.
Applied Materials CFD/DFT: The Cup and handle pattern could still be in play although, ideally, we should have seen a direct breakout. Instead, Thursday’s bearish hammer closed back just below the original breakout level to warn of a hesitancy to break higher, although the overall structure remains bullish. Support has been found at the 20-day eMA, so a break below 51.00 warns of a deeper correction against the dominant trend (and perhaps towards the December trendline). Whereas a break above 53.25 assumes bullish continuation.
Cisco Systems CFD/DFT: A downside break remains the bias as part of a head and shoulders top, whilst prices remain beneath the 48.13 high. Whilst prices have made a half-hearted attempt to move higher, momentum lacks conviction. Ultimately, it remains in the watchlist for a larger downside move but we’re not on high alert of a sell signal just yet.
Related analysis:
S&P500: The Long And Short Of It | Cisco, Welltower, Applied Material
FTSE Pauses At Resistance | CWK, CTEC, IMB
StoneX Financial Ltd (trading as “City Index”) is an execution-only service provider. This material, whether or not it states any opinions, is for general information purposes only and it does not take into account your personal circumstances or objectives. This material has been prepared using the thoughts and opinions of the author and these may change. However, City Index does not plan to provide further updates to any material once published and it is not under any obligation to keep this material up to date. This material is short term in nature and may only relate to facts and circumstances existing at a specific time or day. Nothing in this material is (or should be considered to be) financial, investment, legal, tax or other advice and no reliance should be placed on it.
No opinion given in this material constitutes a recommendation by City Index or the author that any particular investment, security, transaction or investment strategy is suitable for any specific person. The material has not been prepared in accordance with legal requirements designed to promote the independence of investment research. Although City Index is not specifically prevented from dealing before providing this material, City Index does not seek to take advantage of the material prior to its dissemination. This material is not intended for distribution to, or use by, any person in any country or jurisdiction where such distribution or use would be contrary to local law or regulation.
For further details see our full non-independent research disclaimer and quarterly summary.
CFDs are complex instruments and come with a high risk of losing money rapidly due to leverage. 69% of retail investor accounts lose money when trading CFDs with this provider. You should consider whether you understand how CFDs work and whether you can afford to take the high risk of losing your money. CFD and Forex Trading are leveraged products and your capital is at risk. They may not be suitable for everyone. Please ensure you fully understand the risks involved by reading our full risk warning.
City Index is a trading name of StoneX Financial Ltd. Head and Registered Office: 1st Floor, Moor House, 120 London Wall, London, EC2Y 5ET. StoneX Financial Ltd is a company registered in England and Wales, number: 05616586. Authorised and regulated by the Financial Conduct Authority. FCA Register Number: 446717.
City Index is a trademark of StoneX Financial Ltd.
The information on this website is not targeted at the general public of any particular country. It is not intended for distribution to residents in any country where such distribution or use would contravene any local law or regulatory requirement.
© City Index 2024