SP500 Long And Short Of It KSU FBHS CRM DLTR
- The S&P500 made a fresh all-time high on an intraday basis, yet closed back beneath the 3258.10 high. It’s not quite a bearish hammer, but it does show a hesitancy to break higher for now. Still, E-mini futures posted an elongated, bullish hammer and Asia prices are sniffing at the record highs. With Middle East tensions on the back burner (for now) and the potential for a phase one trade deal on Wednesday, we favour the index to break to new highs. However, if it’s to break beneath 3200 then a correction is underway.
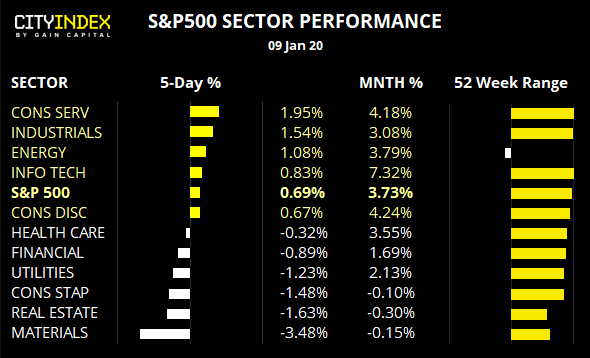
- Info-tech, consumer services and industrials have been the strongest performers over the past 52-weeks. Yet measured from the December 2018 low, the clear winner is the real estate sector having racked up +17.3%. In fact, over this period the only other sector to gain is the communications sector at +2.9%.
- The energy sector remains effectively rangebound, much like crude oil after its failure to break out of its 9-month high. It’s also the only sector to trade lower over the past 52-weeks, and trail other sectors performance by a long shot.
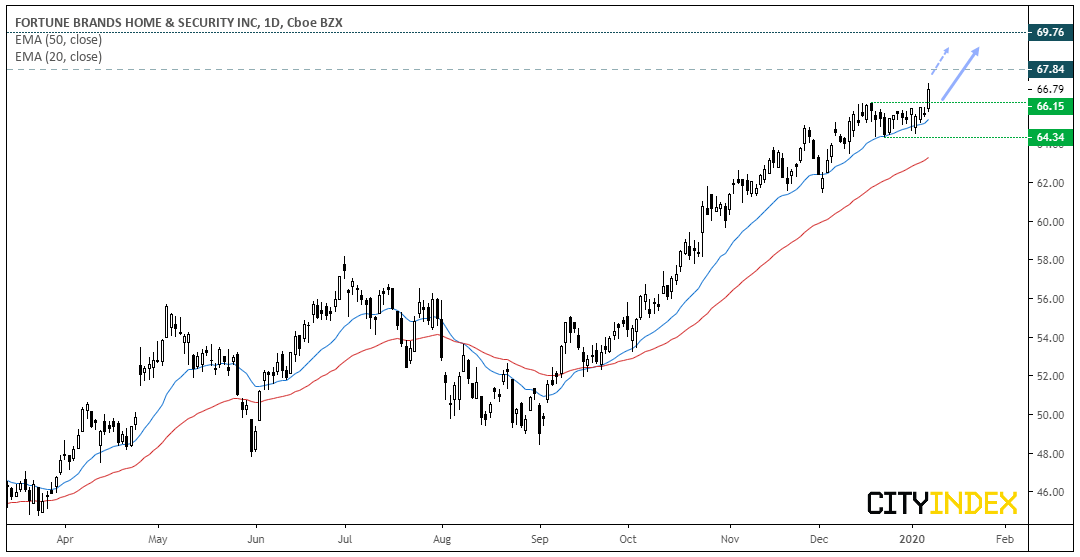
Fortune Brand Home & Security (FBHS): A breakout to new highs has been supported by a strong trend structure, following a period of consolidation at the highs. Furthermore, the breakout was seen in higher than average volume but. The trend remains bullish above 66.34 but traders could seek bullish setups above 66.15.
- Bulls could seek dips above 64.34. Although a direct break above yesterday’s high could entice momentum traders, who could use 66.15 to aid with risk management.
- In Feb 2018 a gap occurred between 67.84 – 69.76 but, given the strength of the trend, we’re targeting the upside of the gap at 69.76.
- A break below 64.34 invalidates the bullish bias over the near-term
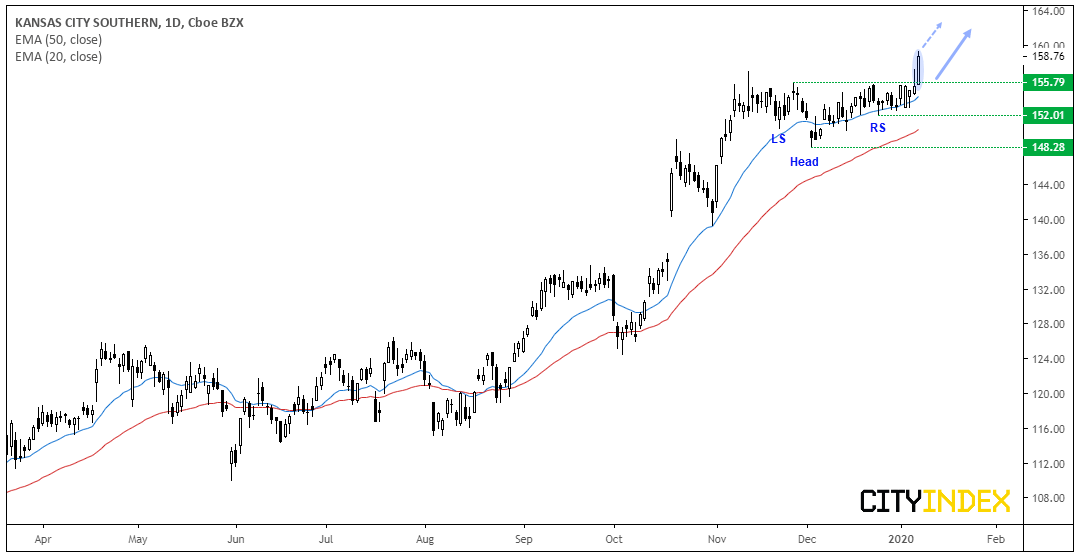
Kansas City Southern (KSU): After consolidating for over two months around record highs, we finally saw a bullish breakout on a strong close to fresh highs. It also appears to have confirmed an inverted head and shoulders pattern, which is a continuation pattern in an uptrend. Moreover, the breakout was on high volume to show strength coming into the move. Whilst the daily trend remains bullish above the 148.28 wing low, momentum traders could look for closer areas of support to aid with risk management.
- A break above yesterday’s high assumes direct gains, and the 155.79 resistance level can be used to aid risk management.
- If prices consolidate, bulls could use the 152 swing low to maintain their bullish bias (as a break below it invalidates the setup).
- Bulls could use an open target with it being at record highs.
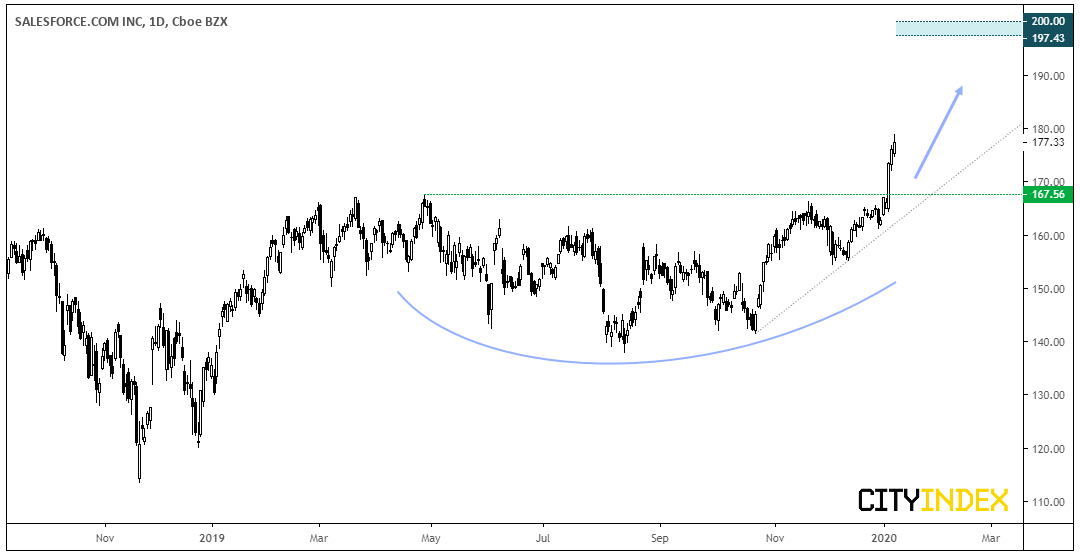
Salesforce.com (CRM): Monday saw a breakout from an 8-month basing pattern on high volume. If The pattern projects a target just below 20, if successful. Ultimately, we remain bullish above the 167.56 breakout level, but we’d prefer to see a pullback towards this key level or a period of consolidation.
- Bulls could wait for a retracement and to see if either the 167.56 breakout level or bullish trendline holds as support.
- Alternatively, if prices consolidate for several days and provide a shallow back, momentum traders could seek a break of the highs.
- Bias remains bullish above 167.56
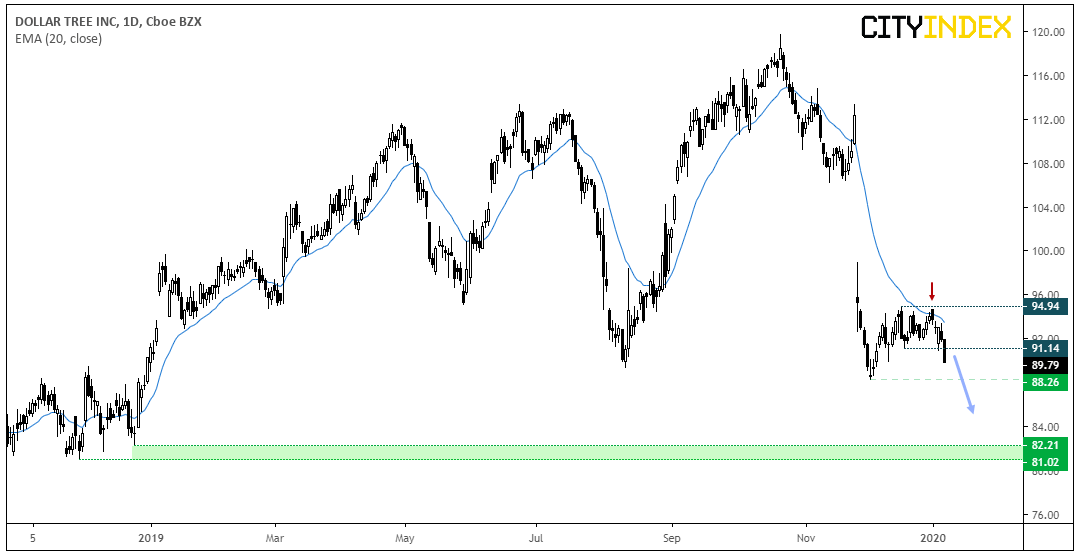
Dollar Tree (DLTR): The dead cat has bounced and is now rolling over once more. Following a 13% gap lower in late November, it spent best part of December trying (but ultimately failing) to lift itself from the lows. Bearish momentum has clearly returned and the correction appears to have ended at 94.94.
- Bias remains bearish below 94.94. although bears could also use 91.14 resistance to aid with risk management (or fade into).
- Due to the strength of the bearish trend, we anticipate a downside break of 88.26
- Bears could target the lows around 81-82.
StoneX Financial Ltd (trading as “City Index”) is an execution-only service provider. This material, whether or not it states any opinions, is for general information purposes only and it does not take into account your personal circumstances or objectives. This material has been prepared using the thoughts and opinions of the author and these may change. However, City Index does not plan to provide further updates to any material once published and it is not under any obligation to keep this material up to date. This material is short term in nature and may only relate to facts and circumstances existing at a specific time or day. Nothing in this material is (or should be considered to be) financial, investment, legal, tax or other advice and no reliance should be placed on it.
No opinion given in this material constitutes a recommendation by City Index or the author that any particular investment, security, transaction or investment strategy is suitable for any specific person. The material has not been prepared in accordance with legal requirements designed to promote the independence of investment research. Although City Index is not specifically prevented from dealing before providing this material, City Index does not seek to take advantage of the material prior to its dissemination. This material is not intended for distribution to, or use by, any person in any country or jurisdiction where such distribution or use would be contrary to local law or regulation.
For further details see our full non-independent research disclaimer and quarterly summary.
CFDs are complex instruments and come with a high risk of losing money rapidly due to leverage. 69% of retail investor accounts lose money when trading CFDs with this provider. You should consider whether you understand how CFDs work and whether you can afford to take the high risk of losing your money. CFD and Forex Trading are leveraged products and your capital is at risk. They may not be suitable for everyone. Please ensure you fully understand the risks involved by reading our full risk warning.
City Index is a trading name of StoneX Financial Ltd. Head and Registered Office: 1st Floor, Moor House, 120 London Wall, London, EC2Y 5ET. StoneX Financial Ltd is a company registered in England and Wales, number: 05616586. Authorised and regulated by the Financial Conduct Authority. FCA Register Number: 446717.
City Index is a trademark of StoneX Financial Ltd.
The information on this website is not targeted at the general public of any particular country. It is not intended for distribution to residents in any country where such distribution or use would contravene any local law or regulatory requirement.
© City Index 2024