SP500 Long And Short Of It AZO JPM VRSK COG
- The S&P500 nudged its way up to a fresh all-time high yesterday. Without any obvious signs of a top forming, the bias remains bullish above 3069.90.
- 8 of 12 sectors trade at or just below their 52-week highs (or all-time highs, more to the point).
- Energy is the only sector to decline over the past five sessions and trade lower compare with 52-weeks ago.
- Whilst there are plenty of equities rising within the S&P500, finding the ones which don’t appear overextended to the upside (and therefore require consolidation or a retracement) has proven tricky. But on the plus side, we have a large list of bullish equities that will hopefully provide opportunities further out.
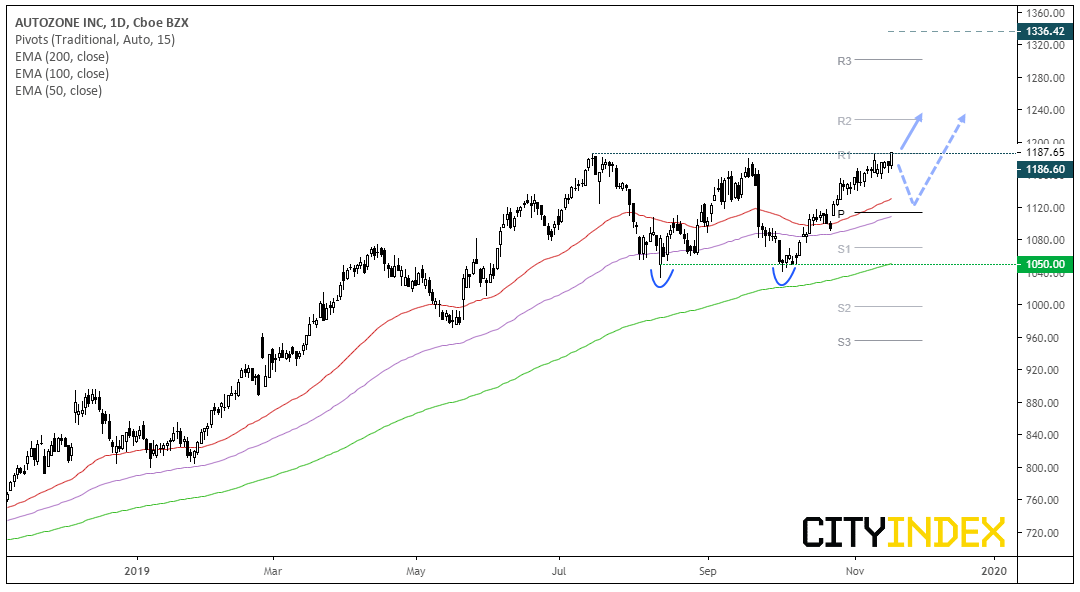
Autozone CFD/DFT (AZO): The automotive parts retailer closed at record highs yesterday, although only just. Still, the equity remains in a clear uptrend and has formed a potential double bottom (which can be a continuation pattern in an uptrend), so we’re looking for this to break higher. Keep in mind that prices have struggled to push higher around current levels twice previously, so bullish momentum need to hold up if the double bottom is to be believed. If prices turn lower, we can reassess – although the trend remains bullish whilst prices hold above the 1040 lows.
- Bias is for the bullish breakout to continue in line with its trend.
- If successful, the double bottom pattern projects and approximate target around 1336.
- Given its at record highs an open upside target can be used. Or bulls can refer to the monthly pivot levels (R2 is currently around 1228 and R3 around 1300 – these levels will obviously change on December 1st).
- However, if bearish momentum takes it back beneath the breakout level it may provide a near-term counter-trend opportunity. Prices have failed to push higher twice near these levels, so it’s certainly a scenario to look out for.
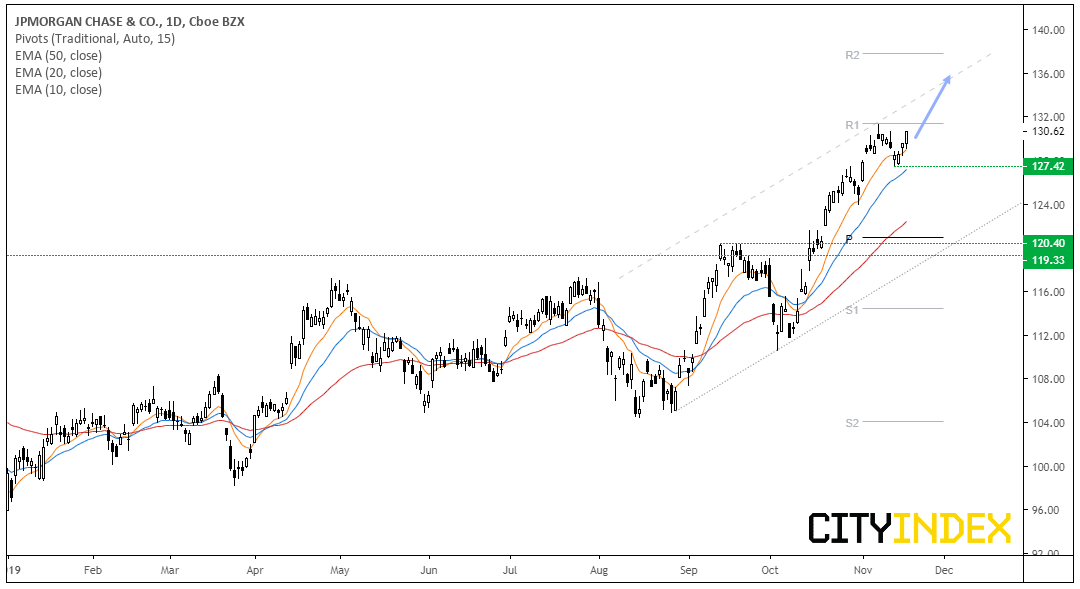
J.P. Morgan Chase CFD/DFT (JPM): Around mid-October, JPM finally broke out of a 20-month consolidation pattern and now sits just off its record high. A decent trend is taking shape and prices are accelerating away from the trendline, which leaves potential for the upper channel to be broken. Moreover, prices are bobbing along the 10-day eMA to show how strong momentum is and a swing low has formed at 127.42.
- Near-term bias remains bullish above 127.42, although a break beneath it merely flags a deeper correction and not a trend reversal.
- A break to record highs could also breach the monthly R2 bring R3 into focus.
- Alternatively, an open upside target could be used with a trailing stop, given prices would be at record highs following a significant breakout of a major, sideways pattern.
Other bullish setups to consider (along the same lines as JPM) are Northern Trust, Valero, LKQ, Hewlett Packard and Paccar Inc.
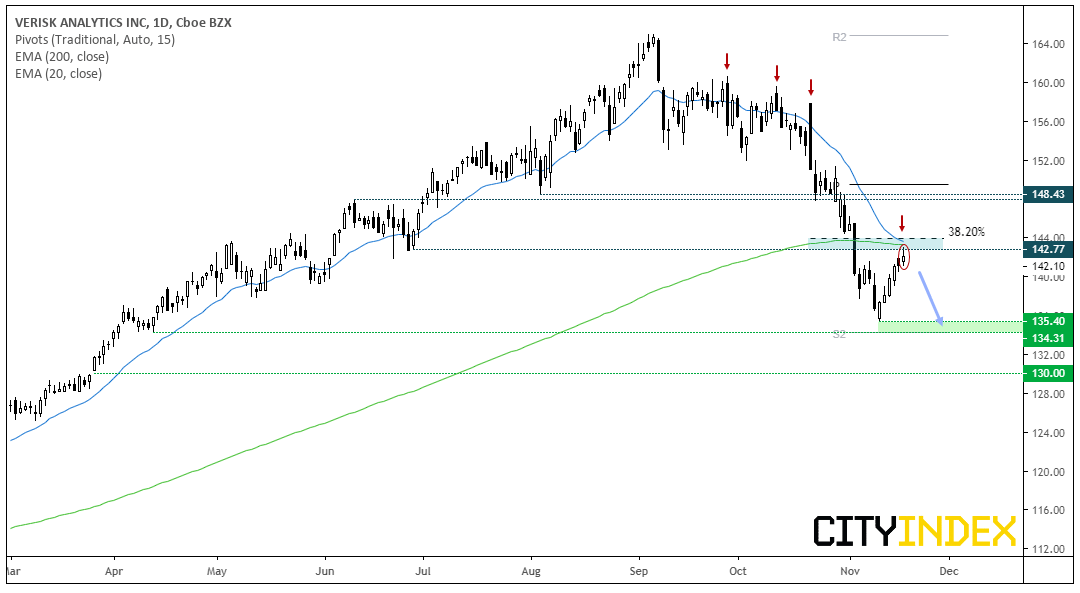
Verisk Analytics CFD/DFT (VRSK): Prices hit a record high in early October before shedding over -17.9% over the next few weeks, taking it on the cusp of a technical bear market. Prices have retreated into a zone of resistance around 144, which comprises of the 20 and 200-day eMAs, 38.2% Fibonacci level and swing lows.
- Bias remains bearish whilst prices trade beneath the resistance cluster
- A bearish hammer has formed at the highs to warn of a hesitancy to push higher, although bears may want to wait for bearish momentum to returns and / or see if prices print a more compelling top (such as a series of doji’s or a 2-bar reversal pattern).
- Initial target is around 134.30/40 where the monthly S2 and structural low reside.
- A break beneath 134 bring 130 into focus, which is a psychological round number and where an upside gap appeared in March.
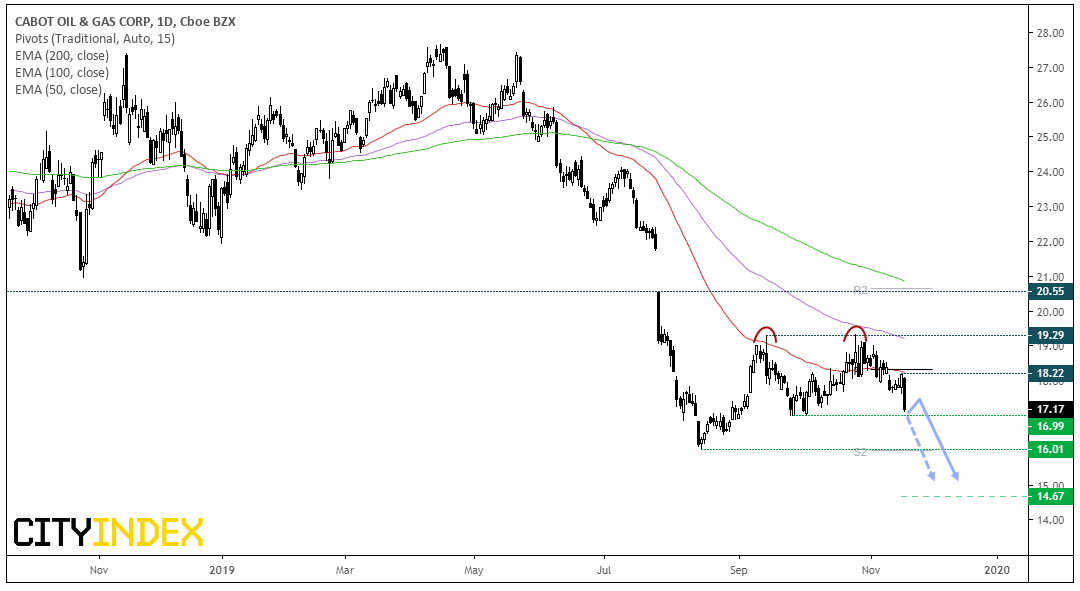
Cabot Oil & Gas Corp CFD/DFT (COG): The independent oil and gas company suffered its most bearish close in nearly 4-months yesterday. That it occurred in line with the dominant, bearish trend suggests it could be headed to new lows. Still, its not uncommon to see a stock rebound the day after a heavy loss, so it’s simply a case of waiting for key support to be broken – whether it be today or thereafter.
- Bias remains bearish whilst prices hold beneath 18.30 (where the 50day eMA, monthly pivot and swing high reside).
- A break beneath 16.99 brings the lows around 16 into focus. However, a double top formed around 19.30 which, if successful, projects an initial target around 14.67
Related analysis:
S&P500: Long Buybacks And Value?
FTSE: The Long & Short Of It | NXT, UTG, EMG, VSVS
ASX200: The Long And Short Of It | XJO, NAN, NCM, BOQ, GNC
S&P500: The Long & Short Of It | SPX, SYS, ORLY, EBAY, TXN
StoneX Financial Ltd (trading as “City Index”) is an execution-only service provider. This material, whether or not it states any opinions, is for general information purposes only and it does not take into account your personal circumstances or objectives. This material has been prepared using the thoughts and opinions of the author and these may change. However, City Index does not plan to provide further updates to any material once published and it is not under any obligation to keep this material up to date. This material is short term in nature and may only relate to facts and circumstances existing at a specific time or day. Nothing in this material is (or should be considered to be) financial, investment, legal, tax or other advice and no reliance should be placed on it.
No opinion given in this material constitutes a recommendation by City Index or the author that any particular investment, security, transaction or investment strategy is suitable for any specific person. The material has not been prepared in accordance with legal requirements designed to promote the independence of investment research. Although City Index is not specifically prevented from dealing before providing this material, City Index does not seek to take advantage of the material prior to its dissemination. This material is not intended for distribution to, or use by, any person in any country or jurisdiction where such distribution or use would be contrary to local law or regulation.
For further details see our full non-independent research disclaimer and quarterly summary.
CFDs are complex instruments and come with a high risk of losing money rapidly due to leverage. 69% of retail investor accounts lose money when trading CFDs with this provider. You should consider whether you understand how CFDs work and whether you can afford to take the high risk of losing your money. CFD and Forex Trading are leveraged products and your capital is at risk. They may not be suitable for everyone. Please ensure you fully understand the risks involved by reading our full risk warning.
City Index is a trading name of StoneX Financial Ltd. Head and Registered Office: 1st Floor, Moor House, 120 London Wall, London, EC2Y 5ET. StoneX Financial Ltd is a company registered in England and Wales, number: 05616586. Authorised and regulated by the Financial Conduct Authority. FCA Register Number: 446717.
City Index is a trademark of StoneX Financial Ltd.
The information on this website is not targeted at the general public of any particular country. It is not intended for distribution to residents in any country where such distribution or use would contravene any local law or regulatory requirement.
© City Index 2024