Silver 8217 s Downward Spiral vs Gold
1 week to go into the end of H1 2013 and silver is down 35%, the worst 6-month performance by any commodity around. Gold is down 23%, copper is off 14%.
You’re probably familiar with the causes: falling inflation risks, weak global conditions and forced selling by hedge funds as well as futures traders in the Comex. The latter dynamic highlights the speculative drive against the metal, compared to copper or platinum. Recall how in spring 2011, US authorities quadrupled silver’s margin requirements to shed $20 off silver 31-year highs. It has now lost 60% of its value, trading below $20.00, the lowest level since September 2010.
Last week’s pronouncements from Fed Chairman Bernanke, suggesting Q4 as a likely start of the tapering of asset purchases ended all hope for any near-term recovery in metals. If the Fed does end up reducing asset purchases before year-end, then “disinflation” will gradually be replaced by “deflation” and mine closures will keep up with the number of commodity hedge funds closures
The latest action from China’s soaring money market rates resulting from dried up liquidity draws an ideal narrative for the proverbial 3rd shoe to drop in the global financial system (US fiscal cliff, European financial dislocations and China’s shadow financial system). Falling silver imports from the US, China and Japan have especially added to confidence among silver bears. The industrial component of silver demand may be here to stay as global growth shows no new signs of life beyond the US.
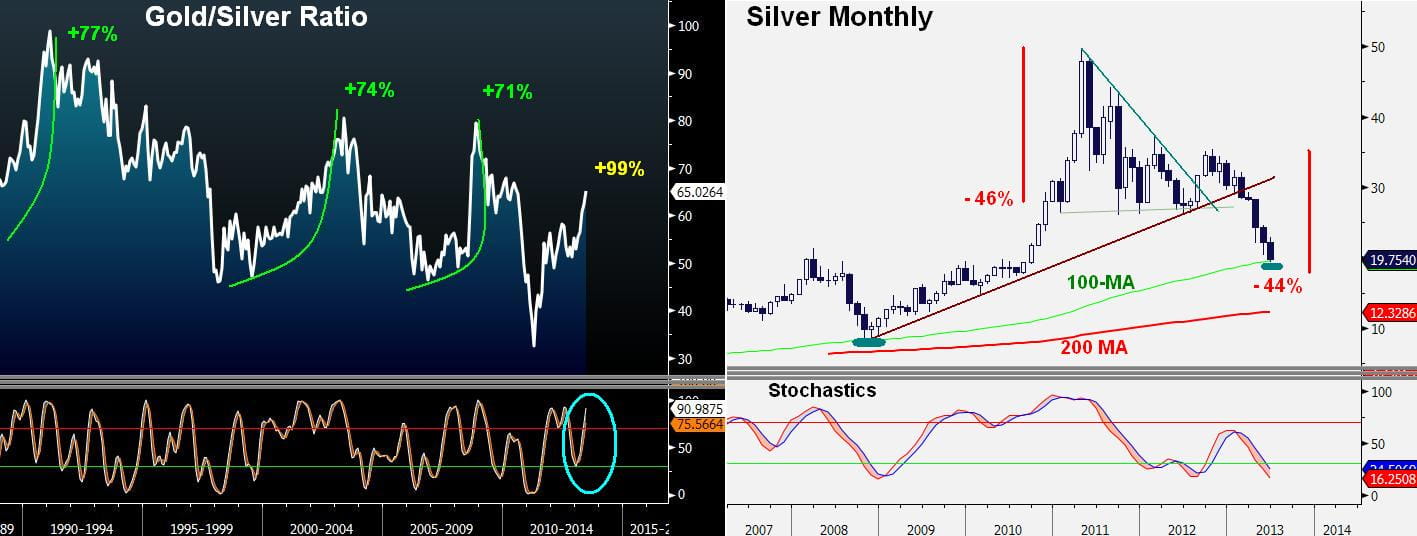
Following gold’s two failed rallies of 12% and 6% in April and May respectively, the next failure point is increasingly suggested to be near 1345-50. This may intensify silver damage, particularly as the Gold/Silver ratio has broken well above its usual +73% rising cycles (see past 20 years in chart) to chart a 99% rally from its 2011 lows.
Does all of this imply that silver’s super rally is over? Yes.
But silver’s two possible sources of technical saving grace are: (i) the 100-month moving average, drifting at 19.45. This may suggest some price stabilization following a 5-month losing run (longest since 1995); (ii) the 44%decline from the October high is nearing the 46% decline from the 2011 peak to the Sep 2011 low. At the current juncture, silver’s technicals point to capping the next attempts at recovery, ranging from 21-23, to re-trigger 19.60-19.70.
StoneX Financial Ltd (trading as “City Index”) is an execution-only service provider. This material, whether or not it states any opinions, is for general information purposes only and it does not take into account your personal circumstances or objectives. This material has been prepared using the thoughts and opinions of the author and these may change. However, City Index does not plan to provide further updates to any material once published and it is not under any obligation to keep this material up to date. This material is short term in nature and may only relate to facts and circumstances existing at a specific time or day. Nothing in this material is (or should be considered to be) financial, investment, legal, tax or other advice and no reliance should be placed on it.
No opinion given in this material constitutes a recommendation by City Index or the author that any particular investment, security, transaction or investment strategy is suitable for any specific person. The material has not been prepared in accordance with legal requirements designed to promote the independence of investment research. Although City Index is not specifically prevented from dealing before providing this material, City Index does not seek to take advantage of the material prior to its dissemination. This material is not intended for distribution to, or use by, any person in any country or jurisdiction where such distribution or use would be contrary to local law or regulation.
For further details see our full non-independent research disclaimer and quarterly summary.
CFDs are complex instruments and come with a high risk of losing money rapidly due to leverage. 69% of retail investor accounts lose money when trading CFDs with this provider. You should consider whether you understand how CFDs work and whether you can afford to take the high risk of losing your money. CFD and Forex Trading are leveraged products and your capital is at risk. They may not be suitable for everyone. Please ensure you fully understand the risks involved by reading our full risk warning.
City Index is a trading name of StoneX Financial Ltd. Head and Registered Office: 1st Floor, Moor House, 120 London Wall, London, EC2Y 5ET. StoneX Financial Ltd is a company registered in England and Wales, number: 05616586. Authorised and regulated by the Financial Conduct Authority. FCA Register Number: 446717.
City Index is a trademark of StoneX Financial Ltd.
The information on this website is not targeted at the general public of any particular country. It is not intended for distribution to residents in any country where such distribution or use would contravene any local law or regulatory requirement.
© City Index 2024