Shell profit surprises whilst BP rekindles doubts
Shell’s surprise rise in headline quarterly profits is rightly impressing shareholders, whilst rival BP still has work to do.
Although the result is fairly noisy and even a little foggy (note the group excludes “identified items”) it’s still clear the benefit from rising BG volumes is kicking in, whilst a more adroit recalibration of expenses is also showing too.
On a related note, ‘forward guidance’ on capex plans continues, as the group continues its rolling programme of reducing the gradient of future capex, this time to the lower end of the prior range in 2017 (c. $25bn).
Maybe the quarter was a fortunate one for production write-off costs, which could pick up in H1.
In the near future investors might judge the group’s positive ‘exit’ activities—its disposal programme—more harshly. There’s a built in contradiction in Shell trying to sell $30bn in non-core assets into a low oil-price environment.
There’s ample room for the group to trip up on further bumps in the road, particularly on dividends.
Shell is currently sporting what could be best described as a ‘technically covered’ dividend, rather than a ‘technically uncovered’ one and it’s difficult to see how the group can avoid dipping into borrowings to temporarily maintain coverage at some point during the next 18 months.
But no one thinks a Shell pay-out crisis is brewing.
It still looks to have played its own particular hand better than many oil majors in the quarter, and CEO van Beurden’s “Dividend Statement” succeeded in avoiding all sensitive eggshells for now as well.
For BP, the £728m one-off accounting gain which flattered the upstream outcome, and downstream underlying pre-tax profit decline of 39% y/y to £1.4bn, make the verdict on its figures poorer than many City of expectations.
It’s an unfortunate disappointment from a group which in many ways is more solid than others of a similar size.
BP has, however, continued to demonstrate resilient cash-generative strength during the quarter which does not look fully priced into its stock, although to be sure, to an extent the discount is linked to low oil prices.
Still, BP’s long-term coverage profile easily looks more assured than its FTSE rival, with a range of 1.4-1.6 times not seen as a particularly punchy call in the City for the next three years.
BP stating that it remains on track to achieve organic free cash flow (net of Gulf of Mexico payments) with oil at $50bbl-$55bbl might be the strongest positive takeaway from its Q3 figures.
Shareholders however are judging BP based on recent performance against other super majors and have found the group wanting.
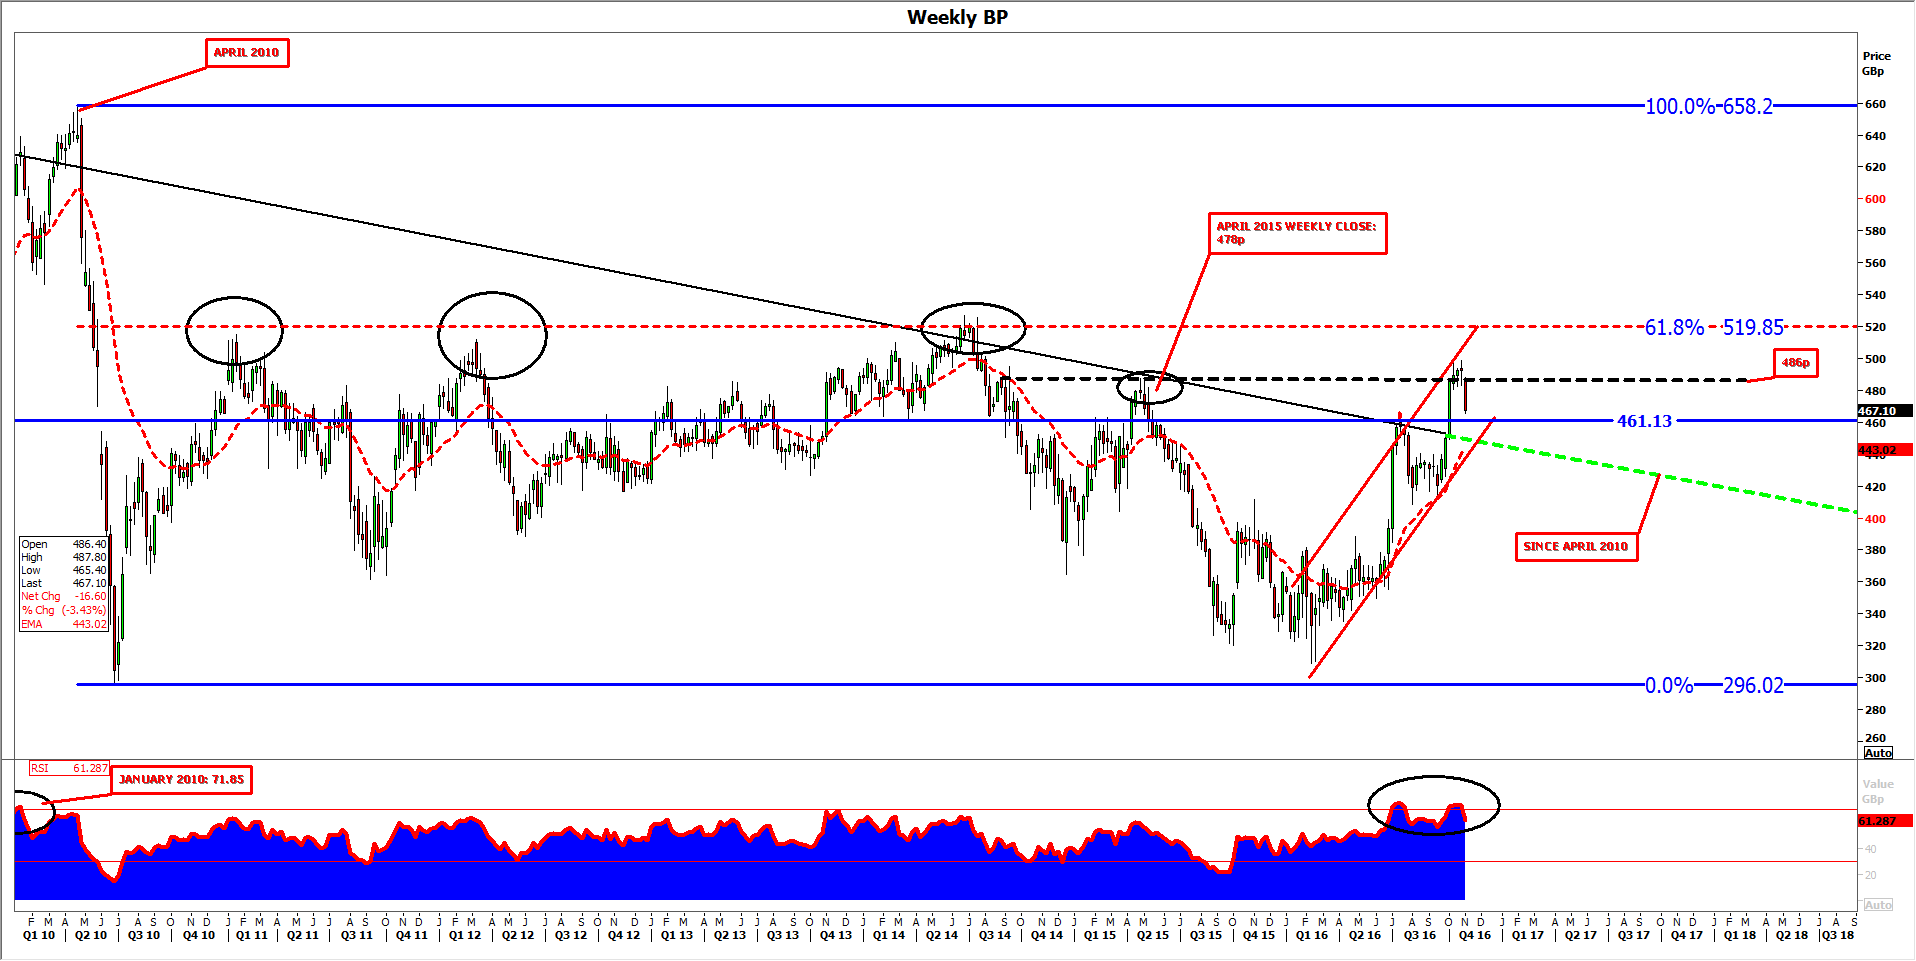
From a technical chart perspective, BP continues to look more attractive than Shell due to apparent potential for upside in the medium term.
- However, a misstep on fundamentals is coinciding with the share’s reversal at a long-term resistance line at 486p (the shares tagged prices around there on August 2014 and May 2015).
- Traders will be keen to see how the stock performs at the lower side of the resistance/support range closer to 461p.
- If that is sustainably breached, BP’s hard-won victory, around a fortnight ago, over a descending trend that capped the stock for more than ten years, may turn out to be a false dawn.
- More positively, the stock has respected a clear rising channel for most of the year.
- Confluence with the declining trend and 461p support the case that the group’s cash generative strengths will continue to be appreciated in the medium term despite a disappointing quarter.
WEEKLY CHART
Please click image to enlarge
StoneX Financial Ltd (trading as “City Index”) is an execution-only service provider. This material, whether or not it states any opinions, is for general information purposes only and it does not take into account your personal circumstances or objectives. This material has been prepared using the thoughts and opinions of the author and these may change. However, City Index does not plan to provide further updates to any material once published and it is not under any obligation to keep this material up to date. This material is short term in nature and may only relate to facts and circumstances existing at a specific time or day. Nothing in this material is (or should be considered to be) financial, investment, legal, tax or other advice and no reliance should be placed on it.
No opinion given in this material constitutes a recommendation by City Index or the author that any particular investment, security, transaction or investment strategy is suitable for any specific person. The material has not been prepared in accordance with legal requirements designed to promote the independence of investment research. Although City Index is not specifically prevented from dealing before providing this material, City Index does not seek to take advantage of the material prior to its dissemination. This material is not intended for distribution to, or use by, any person in any country or jurisdiction where such distribution or use would be contrary to local law or regulation.
For further details see our full non-independent research disclaimer and quarterly summary.
CFDs are complex instruments and come with a high risk of losing money rapidly due to leverage. 69% of retail investor accounts lose money when trading CFDs with this provider. You should consider whether you understand how CFDs work and whether you can afford to take the high risk of losing your money. CFD and Forex Trading are leveraged products and your capital is at risk. They may not be suitable for everyone. Please ensure you fully understand the risks involved by reading our full risk warning.
City Index is a trading name of StoneX Financial Ltd. Head and Registered Office: 1st Floor, Moor House, 120 London Wall, London, EC2Y 5ET. StoneX Financial Ltd is a company registered in England and Wales, number: 05616586. Authorised and regulated by the Financial Conduct Authority. FCA Register Number: 446717.
City Index is a trademark of StoneX Financial Ltd.
The information on this website is not targeted at the general public of any particular country. It is not intended for distribution to residents in any country where such distribution or use would contravene any local law or regulatory requirement.
© City Index 2024