Seasonals Suggest A Lower Vix For September
Seasonality Suggests A Lower VIX For September
It's been a volatile month for markets, with the fallout from the ongoing trade war, attacks on the Fed, Brexit and Italian elections (to name a few rivers). This may feel counter to how markets ‘should be’ during the lazy summer periods yet, according to the seasonality for VIX, it appears to be on track for a typical summer month.
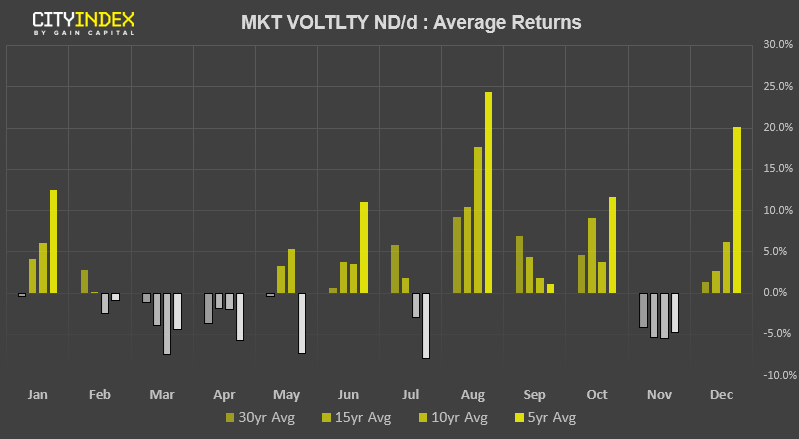
Taking the past 30 years of data, we can see that the VIX is typically higher during the month of August. Moreover, the average has increased if we measure over the past 5, 10 and 15 years. Whilst each August will have its own tale to tell, it can partly rationalised to a lower liquidity environment which can leave markets (such as the S&P500) more vulnerable to large moves from perhaps smaller headlines.
Looking forward, we can see that the level of VIX typically lowers during September as traders return to their desks. In turn, this could suggest we’re in for a period of dull, sideways trading or (hopefully) lower volatility at the beginning of new trends amid a more liquid market. Of course, time will tell, but it’ something to consider moving forward (and whilst the S&P500 remains rangebound).
It’s possible we may not see the S&P500 break out of range until traders (and therefore volumes) return, so traders could look to buy at the lows or short at the highs. However, we’ve noticed that the AAII Sentiment Survey (American Association of Individual Investors) has signalled a bearish extreme earlier this month. As with most sentiment indicators, timing can be off, but looking back through history shows that extremely low readings can occur some time around the actual price low, give or take a few weeks. The indicator is the spread between bullish and bearish investors, and the dotted lines represent +/1 1 standard deviation. And, given we’ve seen the yield curve invert which has historically been bullish for the S&P500, perhaps traders will want to enter long when they return from their break. As always, let price action be your guide.
Related analysis:
Forward Returns Following A US10-2 Year Inversion
StoneX Financial Ltd (trading as “City Index”) is an execution-only service provider. This material, whether or not it states any opinions, is for general information purposes only and it does not take into account your personal circumstances or objectives. This material has been prepared using the thoughts and opinions of the author and these may change. However, City Index does not plan to provide further updates to any material once published and it is not under any obligation to keep this material up to date. This material is short term in nature and may only relate to facts and circumstances existing at a specific time or day. Nothing in this material is (or should be considered to be) financial, investment, legal, tax or other advice and no reliance should be placed on it.
No opinion given in this material constitutes a recommendation by City Index or the author that any particular investment, security, transaction or investment strategy is suitable for any specific person. The material has not been prepared in accordance with legal requirements designed to promote the independence of investment research. Although City Index is not specifically prevented from dealing before providing this material, City Index does not seek to take advantage of the material prior to its dissemination. This material is not intended for distribution to, or use by, any person in any country or jurisdiction where such distribution or use would be contrary to local law or regulation.
For further details see our full non-independent research disclaimer and quarterly summary.
CFDs are complex instruments and come with a high risk of losing money rapidly due to leverage. 69% of retail investor accounts lose money when trading CFDs with this provider. You should consider whether you understand how CFDs work and whether you can afford to take the high risk of losing your money. CFD and Forex Trading are leveraged products and your capital is at risk. They may not be suitable for everyone. Please ensure you fully understand the risks involved by reading our full risk warning.
City Index is a trading name of StoneX Financial Ltd. Head and Registered Office: 1st Floor, Moor House, 120 London Wall, London, EC2Y 5ET. StoneX Financial Ltd is a company registered in England and Wales, number: 05616586. Authorised and regulated by the Financial Conduct Authority. FCA Register Number: 446717.
City Index is a trademark of StoneX Financial Ltd.
The information on this website is not targeted at the general public of any particular country. It is not intended for distribution to residents in any country where such distribution or use would contravene any local law or regulatory requirement.
© City Index 2024