Saudi Oil Attacks WTI levels to watch
Oil prices have resumed higher after initially easing off noticeably following the weekend’s big gap. The US government has alleged that Iran was behind attacks, although Tehran denies any involvement. Houthi rebels in Yemen have claimed responsibility.
The situation remains perilous, and oil prices are likely to move sharply depending on what happens next. Will there be further militant attacks? Will Saudi Arabia and/or the US retaliate, especially if Iran is proved to be involved? The possibility of military action is a risk that investors cannot rule out at this stage. It is also not clear how badly Saudi’s production capacity has been impacted and how long it will take for operations to resume at full capacity. We think that oil prices are likely to fall back once the Middle East situation calms down slightly. After all, the demand outlook remains soft with global data deteriorating – including from the top oil consumer China, as evidenced in the latest industrial data released overnight. From a supply point of view, OPEC’s other members will be more than happy to step up production to make up for some of the short falls in Saudi’s regular crude production. US President Donald Trump has meanwhile already authorised the release of US reserves.
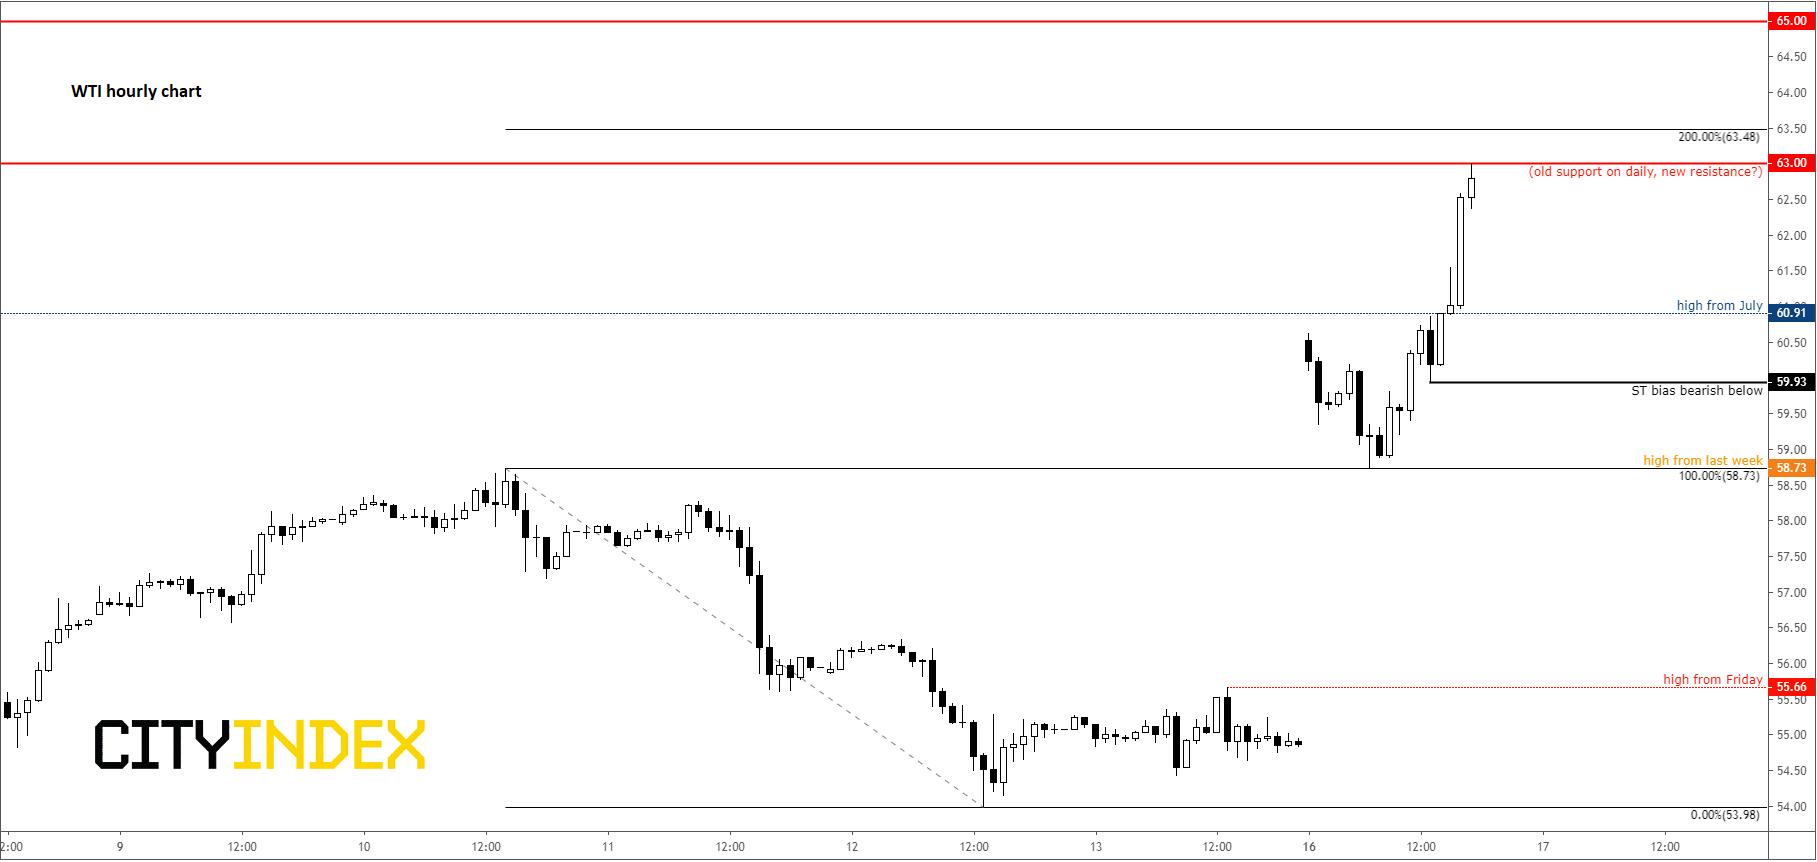
As oil prices soar, it is worth keeping a close eye on crude and related markets such as the major global indices, energy stocks and Canadian and Norwegian dollars, to spot decent tradable opportunities. On that note, here is an intraday chart of WTI, with the key price levels to use as reference points:
Source: Trading View and City Index.
Among the above levels…
- $63.00 is an interesting area to watch for it was a key support zone before it broke down back in May, leading to a sizeable drop in oil prices. Once support, could it turn into resistance? The bears would like to see a close below this area, while the bulls would be keen to see strength into the close and a finish above this hurdle.
- $59.93 is the most recent low on the 60 min time frame. Thus, if oil prices were to go back below this level, we may see some long-side liquidation. So, if you are bearish on prices, a break below this level is what you may be after, unless an even more significant reversal pattern is observed at higher levels first.
- $58.73 was the high from last week – interestingly, this has turned into support earlier in today’s session. An eventual break below here could pave the way for the closure of the weekend gap.
StoneX Financial Ltd (trading as “City Index”) is an execution-only service provider. This material, whether or not it states any opinions, is for general information purposes only and it does not take into account your personal circumstances or objectives. This material has been prepared using the thoughts and opinions of the author and these may change. However, City Index does not plan to provide further updates to any material once published and it is not under any obligation to keep this material up to date. This material is short term in nature and may only relate to facts and circumstances existing at a specific time or day. Nothing in this material is (or should be considered to be) financial, investment, legal, tax or other advice and no reliance should be placed on it.
No opinion given in this material constitutes a recommendation by City Index or the author that any particular investment, security, transaction or investment strategy is suitable for any specific person. The material has not been prepared in accordance with legal requirements designed to promote the independence of investment research. Although City Index is not specifically prevented from dealing before providing this material, City Index does not seek to take advantage of the material prior to its dissemination. This material is not intended for distribution to, or use by, any person in any country or jurisdiction where such distribution or use would be contrary to local law or regulation.
For further details see our full non-independent research disclaimer and quarterly summary.
CFDs are complex instruments and come with a high risk of losing money rapidly due to leverage. 69% of retail investor accounts lose money when trading CFDs with this provider. You should consider whether you understand how CFDs work and whether you can afford to take the high risk of losing your money. CFD and Forex Trading are leveraged products and your capital is at risk. They may not be suitable for everyone. Please ensure you fully understand the risks involved by reading our full risk warning.
City Index is a trading name of StoneX Financial Ltd. Head and Registered Office: 1st Floor, Moor House, 120 London Wall, London, EC2Y 5ET. StoneX Financial Ltd is a company registered in England and Wales, number: 05616586. Authorised and regulated by the Financial Conduct Authority. FCA Register Number: 446717.
City Index is a trademark of StoneX Financial Ltd.
The information on this website is not targeted at the general public of any particular country. It is not intended for distribution to residents in any country where such distribution or use would contravene any local law or regulatory requirement.
© City Index 2024