Samsung Breakaway Gap The Beginning Of Something Larger
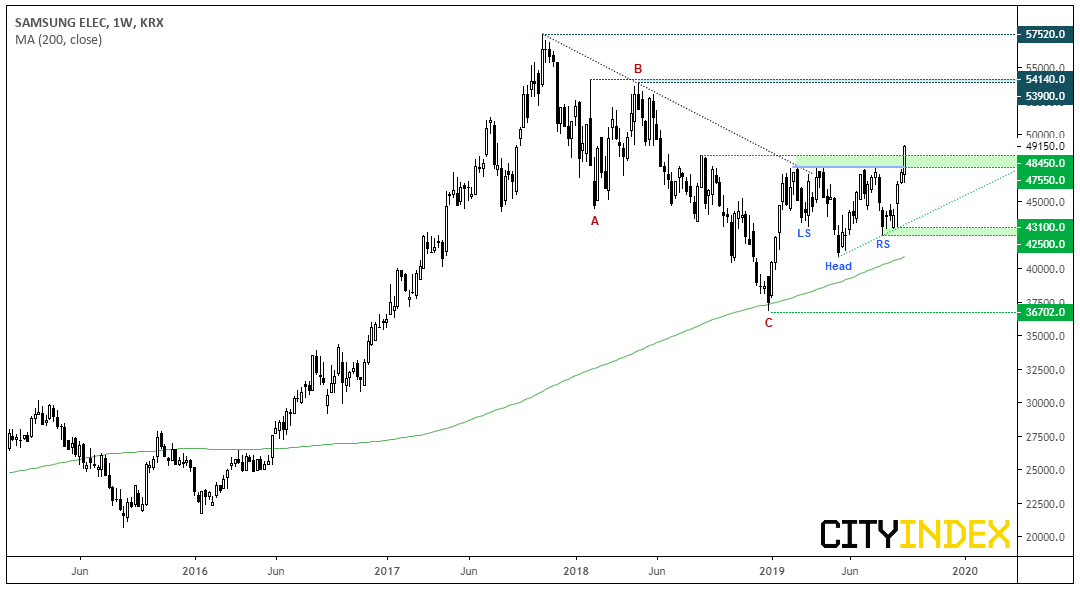
Starting on the weekly chart, Samsung enjoyed a strong bullish run throughout most of 2016 to 2018, before embarking on a 15-month correction. Coming in three distinct waves, the ABC retracement appears to have terminated at 36,850 having found support at the 200-week MA in December and bullish momentum is now back in control.
Two higher lows have formed as part of an inverted head and shoulders pattern which, if successful, projects an initial target just above the 2018 highs. This week’s breakout has confirmed the bullish reversal pattern, although if we have indeed seen the end of the 15-month ABC correction, it should be breaking to record highs over the coming months. And assuming the head is the end of wave 2 retracement, this week’s breakout assumes we’re now in a iii or 3 wave.
Switching to the daily chart shows just how strong bullish momentum is. A small bullish hammer shows a minor pullback to 46,400 ahead of a daily close above 47,750 which confirmed the head and shoulders reversal. However, a breakaway gap on above-average volume saw prices explode higher to close above 49,000 yesterday and today’s price action has also gapped higher. Granted, we could find interim resistance around 50k but, given the strength of the breakout, we don’t envisage yesterday’s gap to be filled.
- Samsung could be suitable to intraday momentum traders, or bulls who prefer to buy dips on the daily chart. Look for 48,450 to hold as support on the daily chart (or a higher low form above this key level if resistance is found around 50k).
- Alternatively, intraday traders could seek bullish positions to try and ride the current momentum ahead of 50k.
- The near-term bullish bias is invalidated with a break below 48,450
- The bullish daily trend remains valid above 46,400 (although a test of this level would invalidate the head and shoulders pattern)
StoneX Financial Ltd (trading as “City Index”) is an execution-only service provider. This material, whether or not it states any opinions, is for general information purposes only and it does not take into account your personal circumstances or objectives. This material has been prepared using the thoughts and opinions of the author and these may change. However, City Index does not plan to provide further updates to any material once published and it is not under any obligation to keep this material up to date. This material is short term in nature and may only relate to facts and circumstances existing at a specific time or day. Nothing in this material is (or should be considered to be) financial, investment, legal, tax or other advice and no reliance should be placed on it.
No opinion given in this material constitutes a recommendation by City Index or the author that any particular investment, security, transaction or investment strategy is suitable for any specific person. The material has not been prepared in accordance with legal requirements designed to promote the independence of investment research. Although City Index is not specifically prevented from dealing before providing this material, City Index does not seek to take advantage of the material prior to its dissemination. This material is not intended for distribution to, or use by, any person in any country or jurisdiction where such distribution or use would be contrary to local law or regulation.
For further details see our full non-independent research disclaimer and quarterly summary.
CFDs are complex instruments and come with a high risk of losing money rapidly due to leverage. 69% of retail investor accounts lose money when trading CFDs with this provider. You should consider whether you understand how CFDs work and whether you can afford to take the high risk of losing your money. CFD and Forex Trading are leveraged products and your capital is at risk. They may not be suitable for everyone. Please ensure you fully understand the risks involved by reading our full risk warning.
City Index is a trading name of StoneX Financial Ltd. Head and Registered Office: 1st Floor, Moor House, 120 London Wall, London, EC2Y 5ET. StoneX Financial Ltd is a company registered in England and Wales, number: 05616586. Authorised and regulated by the Financial Conduct Authority. FCA Register Number: 446717.
City Index is a trademark of StoneX Financial Ltd.
The information on this website is not targeted at the general public of any particular country. It is not intended for distribution to residents in any country where such distribution or use would contravene any local law or regulatory requirement.
© City Index 2024