Sainsbury 8217 s sales stay soft
Sainsbury’s is running to stand still, and without Argos, it would be falling behind.
Unfortunately, a combined 0.3% rise in Argos and Sainsbury’s supermarket underlying sales masks a deterioration at Sainsbury’s which investors are unlikely to overlook. Sainsbury’s 0.5% like-for-like shrinkage shows that growth between Christmas and end-February of 0.1%-0.3% has faded. It coincides with a moderate hardening of prices on the high street, though it’s too early to attribute to any sort of impact on demand.
Sainsbury’s 0.5% LFL decline is the same as in July-September. That at least suggests visibility is returning to the supermarket performance, even if the failure to keep momentum from the winter months going is concerning. As to input cost pressures, the group’s statement skirts the issue of how soon they might need to be filtered out to customers, noting only that “the impact of cost price pressures remains uncertain”. That’s reasonable given the fluid outlook for exchange rates. However, it is inconceivable that Sainsbury’s and its closest competitors will not have modelled for an environment where prices steepen sharply. That gives a slightly different feel to the outlook they’re expecting than “uncertain”.
Sainsbury’s losing the food fight
For the moment though, the bulk of the 6.8% September-January hike in wholesale food prices is largely being masked by supply contracts which prevent significant increases over the short term. Therefore, to us, in light of food sales growth recently swinging into positive at Morrisons and Tesco, the continuing retreat by Sainsbury’s simply suggests it has been outmanoeuvred on price. That calls recent strategic changes by Food Commercial Director Paul Mills-Hicks further into question.
The group later on Thursday spotlighted its efforts to mitigate cost price pressures within its supply chains and said it would continue to cut costs to try to limit price rises for shoppers. Whilst prudent, Sainsbury’s is not unique in taking such measure, meaning that it is merely keeping pace with its competitors, at least on the cost front. It may even be that it’s rival Big 4 supermarkets are further down the road in cost smarts, given that large swathes of their top management teams were not distracted by a takeover last year, like Sainsbury’s execs.
The continuing bright side of the group is of course Argos, where same-store sales accelerated to 4.3% from 4% in the third quarter, confirming that a performance similar to market leader Dixons Carphone is plausible. (Dixons’ UK & Ireland established-store growth was 6% in 10 weeks to early January). The rapid stabilisation of the Argos asset should also silence critics who were sceptical about the logic of the acquisition, though increased exposure to more dynamic general merchandise pricing remains another front for risk.
Sainsbury’s Argos sales do however increase confidence that core operating profit for the year will meet expectations of a 1% slide to around £694m. If confirmed, investors may be inclined to be more patient whilst the group redoubles grocery efforts to compete more convincingly with rivals, as they reclaim market share from Aldi and Lidl.
Not ripe for a rebound
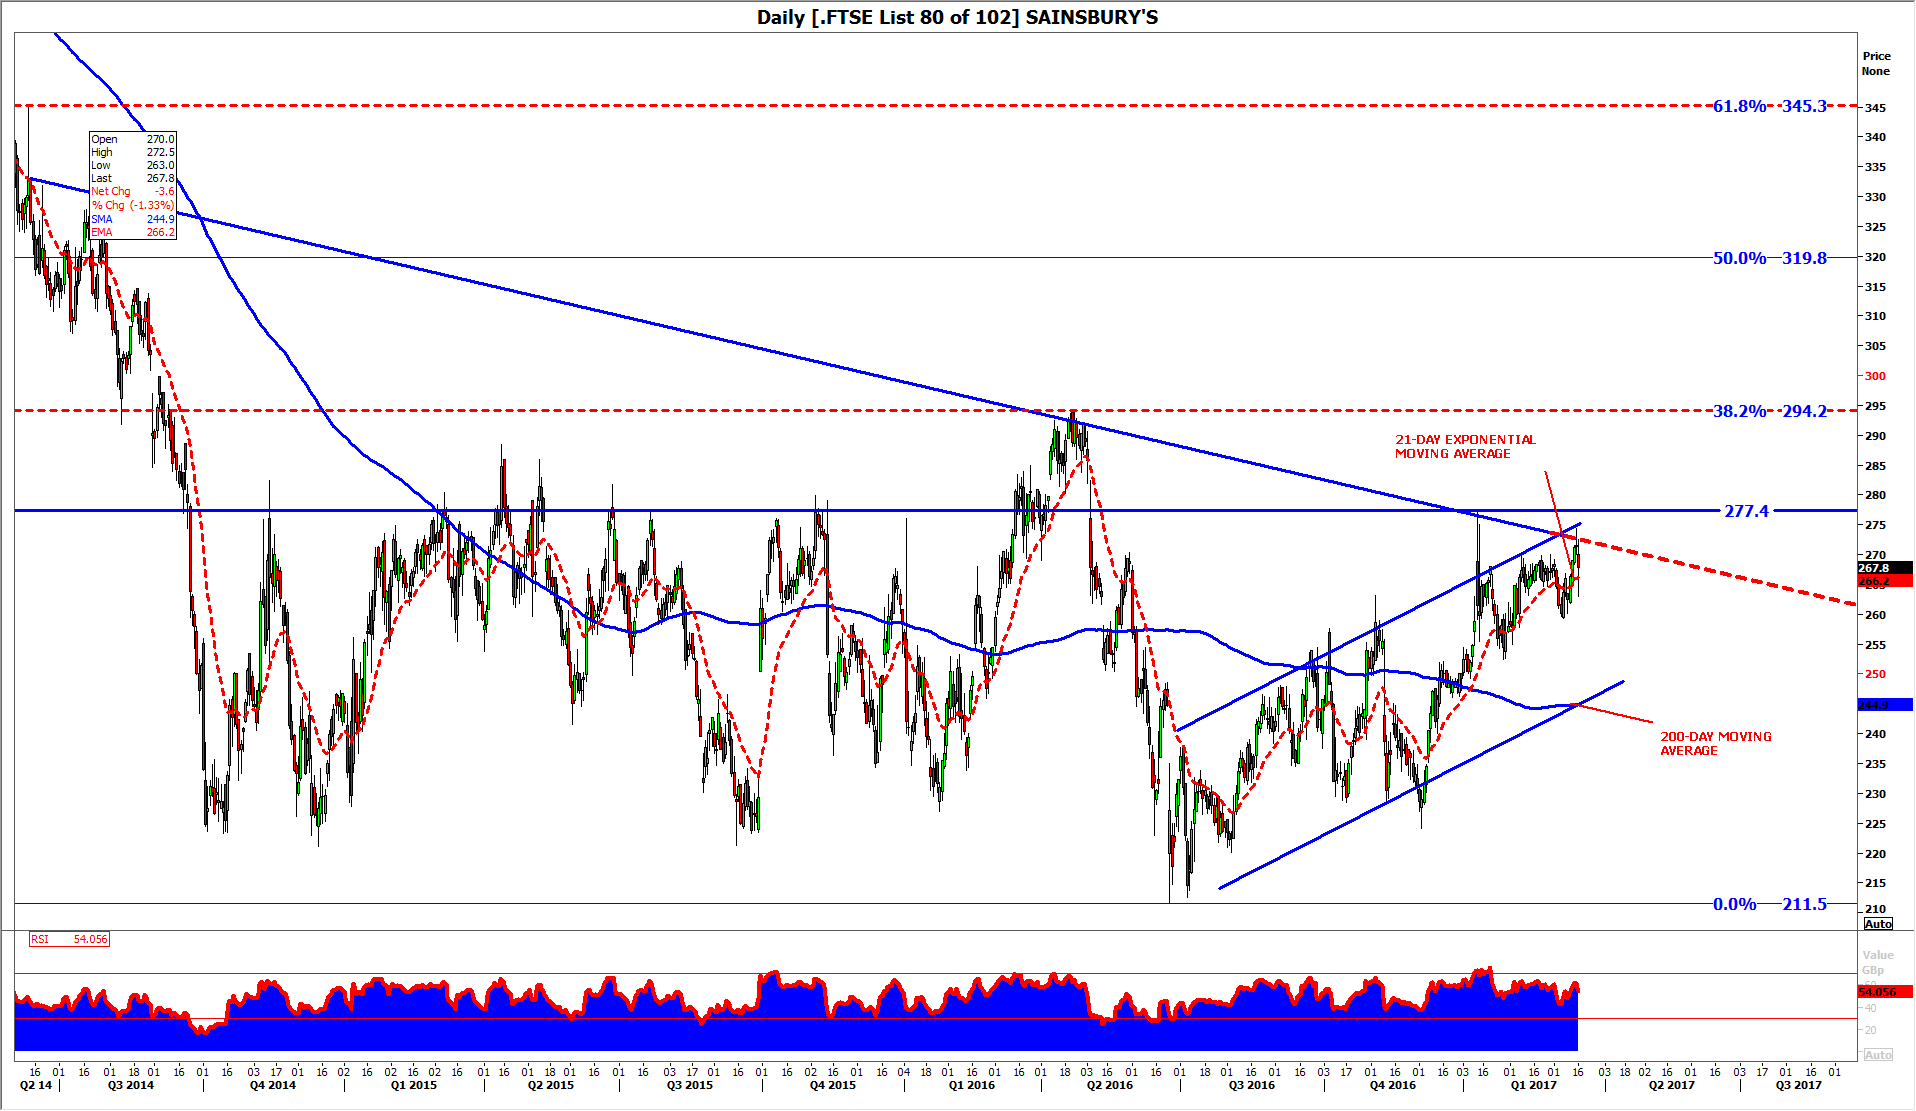
From a technical chart point of view however, any such investor patience may not suffice to sustain the shares’ recent attempt to reclaim lost ground. At the time of writing, the stock was up 24% from the 15-year low it plunged to the day after the Brexit vote. There’s no doubt however that the shares are hitting resistance almost anywhere above 255p, and have done since late 2014. The stock has, on Thursday, certainly respected a clean descending line between June of that year to date. Strong incidence of overhead barriers (including 294p, the 38.2% interval of the decline from November 2014′s six-year high) signal to us that Sainsbury’s shares are still not ready for a sustained uptrend. Weakness back to the 200-day moving average seems likeliest to us over the medium term, though a successful breach of 277p could be the first sign that our view is incorrect. Even if that occurs, our view would not be absolutely disproved unless the shares can pull away from their clearest resistance of the last few years (294p/38.2%) on the upside and keep going. How likely is that to happen whilst the group’s grocery sales underperform?
DAILY CHART: SAINSBURY’S
Source: Thomson Reuters and City Index / please click image to enlarge
StoneX Financial Ltd (trading as “City Index”) is an execution-only service provider. This material, whether or not it states any opinions, is for general information purposes only and it does not take into account your personal circumstances or objectives. This material has been prepared using the thoughts and opinions of the author and these may change. However, City Index does not plan to provide further updates to any material once published and it is not under any obligation to keep this material up to date. This material is short term in nature and may only relate to facts and circumstances existing at a specific time or day. Nothing in this material is (or should be considered to be) financial, investment, legal, tax or other advice and no reliance should be placed on it.
No opinion given in this material constitutes a recommendation by City Index or the author that any particular investment, security, transaction or investment strategy is suitable for any specific person. The material has not been prepared in accordance with legal requirements designed to promote the independence of investment research. Although City Index is not specifically prevented from dealing before providing this material, City Index does not seek to take advantage of the material prior to its dissemination. This material is not intended for distribution to, or use by, any person in any country or jurisdiction where such distribution or use would be contrary to local law or regulation.
For further details see our full non-independent research disclaimer and quarterly summary.
CFDs are complex instruments and come with a high risk of losing money rapidly due to leverage. 69% of retail investor accounts lose money when trading CFDs with this provider. You should consider whether you understand how CFDs work and whether you can afford to take the high risk of losing your money. CFD and Forex Trading are leveraged products and your capital is at risk. They may not be suitable for everyone. Please ensure you fully understand the risks involved by reading our full risk warning.
City Index is a trading name of StoneX Financial Ltd. Head and Registered Office: 1st Floor, Moor House, 120 London Wall, London, EC2Y 5ET. StoneX Financial Ltd is a company registered in England and Wales, number: 05616586. Authorised and regulated by the Financial Conduct Authority. FCA Register Number: 446717.
City Index is a trademark of StoneX Financial Ltd.
The information on this website is not targeted at the general public of any particular country. It is not intended for distribution to residents in any country where such distribution or use would contravene any local law or regulatory requirement.
© City Index 2024