S amp P s long term chart points to potential correction
Global stock markets have experienced numerous volatile days recently as investors decide whether or not to participate in a potential end-of-the-year, or Santa Clause, rally. December is usually a positive month for the US stock markets, possibly because of the effect of ‘window dressing’. This is when money managers buy stocks that have been trending strongly in order to show off to their clients that they are holding the ‘correct’ type of stocks. These stocks tend to be large caps, which have more of an impact on the major indices compared with the small caps. Indeed, this may be the reason why the indices are still holding up well despite the market breadth narrowing i.e. only a handful of large caps are supporting the overall markets, with lots of small caps underperforming.
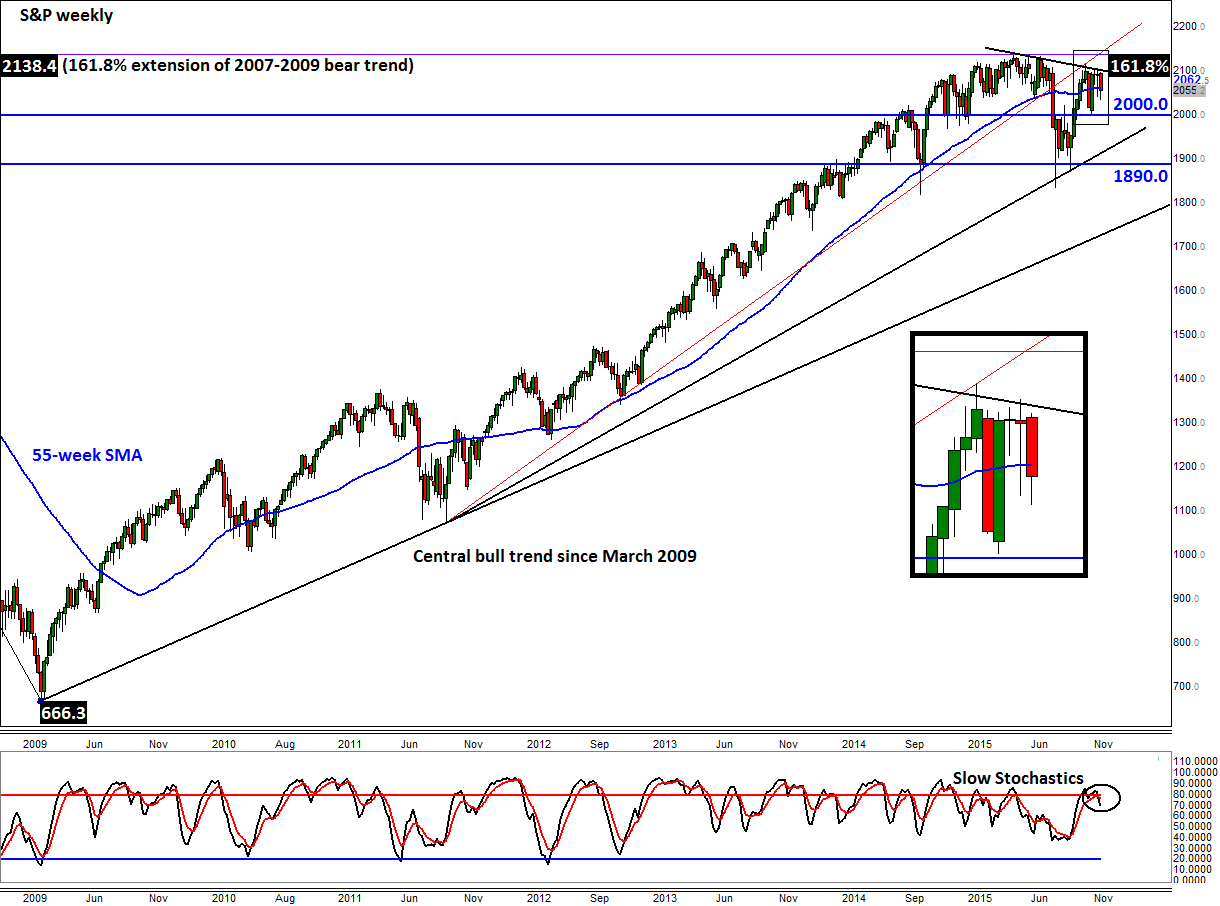
From a technical point of view, the S&P is looking shaky. The weekly chart of the S&P is pointing to a potential correction, barring a ‘last minute’ rally either today or tomorrow. As can be seen, it has created two doji candles just below its bearish trend line in as many weeks, a technical pattern which points to indecision. But although the low of last week’s candle is breached, it hasn’t been done so on a closing basis yet. So, who knows, the “Santa rally” may still be on the way. BUT the market is looking very tired at these elevated levels. While a 2008-style crash may be out of the question, a severe correction is nonetheless probable.
On this time frame, the key support to watch is around 2000, which is still some 55 S&P points away. On the smaller time frames, 2040 is an important support level. So if 2040 breaks then the S&P may initially drop to 2000 before deciding on its next move, which may well be to the downside. Additional long-term supports come in around 1942, which is the 61.8% Fibonacci retracement level of the rally from the August low, followed by the medium-term bullish trend somewhere around 1925/30 (depending on the speed of the potential drop). There is a horizontal support level around 1890, which comes in about 56 points above the August low at 1834. The central bullish trend, which has been established since the markets bottomed out in March 2009, is some distance below, around 1800.
StoneX Financial Ltd (trading as “City Index”) is an execution-only service provider. This material, whether or not it states any opinions, is for general information purposes only and it does not take into account your personal circumstances or objectives. This material has been prepared using the thoughts and opinions of the author and these may change. However, City Index does not plan to provide further updates to any material once published and it is not under any obligation to keep this material up to date. This material is short term in nature and may only relate to facts and circumstances existing at a specific time or day. Nothing in this material is (or should be considered to be) financial, investment, legal, tax or other advice and no reliance should be placed on it.
No opinion given in this material constitutes a recommendation by City Index or the author that any particular investment, security, transaction or investment strategy is suitable for any specific person. The material has not been prepared in accordance with legal requirements designed to promote the independence of investment research. Although City Index is not specifically prevented from dealing before providing this material, City Index does not seek to take advantage of the material prior to its dissemination. This material is not intended for distribution to, or use by, any person in any country or jurisdiction where such distribution or use would be contrary to local law or regulation.
For further details see our full non-independent research disclaimer and quarterly summary.
CFDs are complex instruments and come with a high risk of losing money rapidly due to leverage. 69% of retail investor accounts lose money when trading CFDs with this provider. You should consider whether you understand how CFDs work and whether you can afford to take the high risk of losing your money. CFD and Forex Trading are leveraged products and your capital is at risk. They may not be suitable for everyone. Please ensure you fully understand the risks involved by reading our full risk warning.
City Index is a trading name of StoneX Financial Ltd. Head and Registered Office: 1st Floor, Moor House, 120 London Wall, London, EC2Y 5ET. StoneX Financial Ltd is a company registered in England and Wales, number: 05616586. Authorised and regulated by the Financial Conduct Authority. FCA Register Number: 446717.
City Index is a trademark of StoneX Financial Ltd.
The information on this website is not targeted at the general public of any particular country. It is not intended for distribution to residents in any country where such distribution or use would contravene any local law or regulatory requirement.
© City Index 2024