S amp P 500 The Fundamental and Technical Risks to the Rally
The Fundamental View
There’s no two ways about it: betting against the S&P 500 uptrend has been a fool’s errand over the last few years. It’s now been nearly four years since the S&P 500 last saw a 10% pullback, the third-longest streak in the last half century and well beyond the historical average of one such correction per year. Some traders may argue that this means that a drop is long overdue, but that thought process is already littered with the bodies of other too-early bears. So what are some of the reasons to stand in the way of the runaway bullish freight train?
For one, there are some alarming fundamental developments that we haven’t seen since the bull market kicked off in 2009, and in some cases, since the start of recorded history. Even the most ardent of stock market bulls will admit that stocks are fully valued, if not outright expensive relative to history. The S&P 500’s trailing P/E ratio currently sits well above its long run average at about 21, with longer-term valuation measures like the 10-year cyclically-adjusted P/E ratio coming in at 27, nearly 60% above its historical mean. While stocks could easily become even more richly valued over the next few months, it’s difficult for bulls to make a case that they’re buying at an attractive valuation relative to history.
Meanwhile, S&P 500 companies saw an outright contraction in revenues in Q1 and only just managed to squeak out a marginal increase in earnings through aggressive cost cutting. Such measures are not sustainable in the long run, especially with labor market tightening across the board; to wit, the April JOLTS jobs openings report showed a record-high 5.4M job openings, meaning that employers may soon have start hiking wages aggressively to attract qualified candidates.
Of course, bulls argue that the lackluster Q1 earnings results were driven by temporary factors, including the negative impact of falling oil prices on energy companies and the sharp rise in the value of the US dollar, which hurts the profits of multinational companies. Undoubtedly, the energy sector’s earnings will recover now that oil prices have stabilized, but the true wildcard is the greenback. As I go to press, economist surveys and the Federal Reserve itself expect the central bank to hike interest rates at some point this year, though the fed funds futures traders are more skeptical. Regardless, this marks a sharp monetary policy divergence between the US and the rest of the developed world and may continue to attract funds to the dollar in the coming months. The impact of a strong dollar on corporate earnings is often over-exaggerated, but the potential for continued strength in the dollar could still provide a headwind for large company earnings.
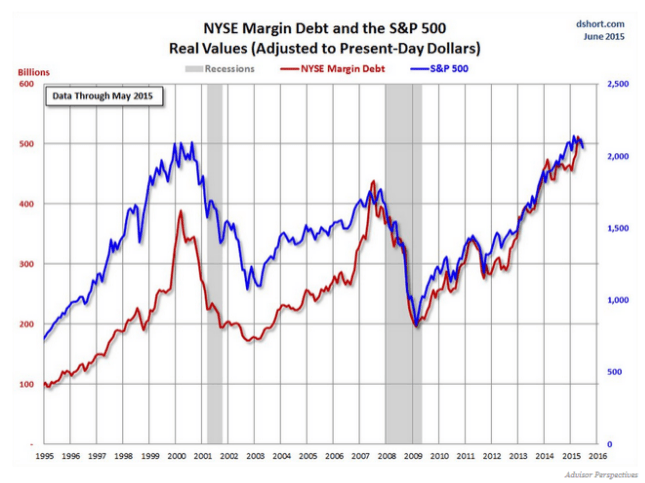
In addition, traders are aggressively borrowing to buy stocks on margin, a historical warning sign for the S&P 500. NYSE margin debt recently hit an all-time high above the $500B threshold, signaling potentially excessive speculative froth in the market. This indicator is by no means a precise timing tool, but it helps to illustrate the high level of exuberance in the market.
The Technical View
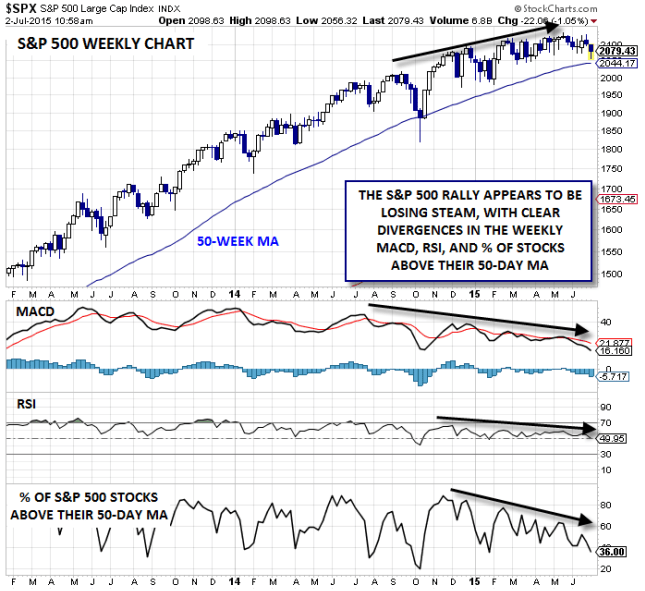
Many of these fundamental concerns could be shrugged off if we weren’t also seeing technical signs that the market was losing steam. Unfortunately, that’s not the case. As of writing, the S&P 500 is up only fractionally on the year, despite being in the historically-bullish third year of a presidential cycle. More to the point, the index has been unable to maintain a breakout to all time highs for more than a few weeks since the start of the year. The sputtering uptrend is particularly evident in the weekly chart, where both the MACD and RSI indicators are showing prolonged bearish divergences, confirming the waning momentum.
Taking a look “under the hood” at the market’s internals shows an additional reason for concern: the number of stocks participating in each subsequent rally is falling. One of the most straightforward ways to measure market breadth is too look at the percentage of stocks trading above a key moving average. When it comes to the S&P 500, there have been fewer and fewer stocks trading above both their 50- and 200-day moving averages on each index peak since the start of the year. This narrowing breadth shows that traders are increasingly piling into a few crowded market leaders; in other words, the stock market is still rising, but the “market of stocks” is not rising in sync.
The panoply of bearish developments is enough to put any reader on edge, but at the end of the day price will always be the most important indicator. To that end, traders may want to keep a close eye on the 12-month moving average (approximated by the 50-week MA below) to confirm a medium-term shift in favor of the sellers. Since the 2009 trough, a monthly close below this key support level has preceded both of the 15% corrections we’ve seen and if seen again, could be the proverbial “straw the breaks the bull’s back.”
StoneX Financial Ltd (trading as “City Index”) is an execution-only service provider. This material, whether or not it states any opinions, is for general information purposes only and it does not take into account your personal circumstances or objectives. This material has been prepared using the thoughts and opinions of the author and these may change. However, City Index does not plan to provide further updates to any material once published and it is not under any obligation to keep this material up to date. This material is short term in nature and may only relate to facts and circumstances existing at a specific time or day. Nothing in this material is (or should be considered to be) financial, investment, legal, tax or other advice and no reliance should be placed on it.
No opinion given in this material constitutes a recommendation by City Index or the author that any particular investment, security, transaction or investment strategy is suitable for any specific person. The material has not been prepared in accordance with legal requirements designed to promote the independence of investment research. Although City Index is not specifically prevented from dealing before providing this material, City Index does not seek to take advantage of the material prior to its dissemination. This material is not intended for distribution to, or use by, any person in any country or jurisdiction where such distribution or use would be contrary to local law or regulation.
For further details see our full non-independent research disclaimer and quarterly summary.
CFDs are complex instruments and come with a high risk of losing money rapidly due to leverage. 69% of retail investor accounts lose money when trading CFDs with this provider. You should consider whether you understand how CFDs work and whether you can afford to take the high risk of losing your money. CFD and Forex Trading are leveraged products and your capital is at risk. They may not be suitable for everyone. Please ensure you fully understand the risks involved by reading our full risk warning.
City Index is a trading name of StoneX Financial Ltd. Head and Registered Office: 1st Floor, Moor House, 120 London Wall, London, EC2Y 5ET. StoneX Financial Ltd is a company registered in England and Wales, number: 05616586. Authorised and regulated by the Financial Conduct Authority. FCA Register Number: 446717.
City Index is a trademark of StoneX Financial Ltd.
The information on this website is not targeted at the general public of any particular country. It is not intended for distribution to residents in any country where such distribution or use would contravene any local law or regulatory requirement.
© City Index 2024