S amp P 500 testing key resistance
Last week, we took a look at the weekly chart of the S&P 500 and mentioned two very important support and resistance ranges: 1800-1830 on the downside and 1933-1950 on the upside. We said that while a breakout is a possibility, so too is range-bound price action within these large ranges and whatever the outcome, there should be plenty of trading opportunities to look forward to.
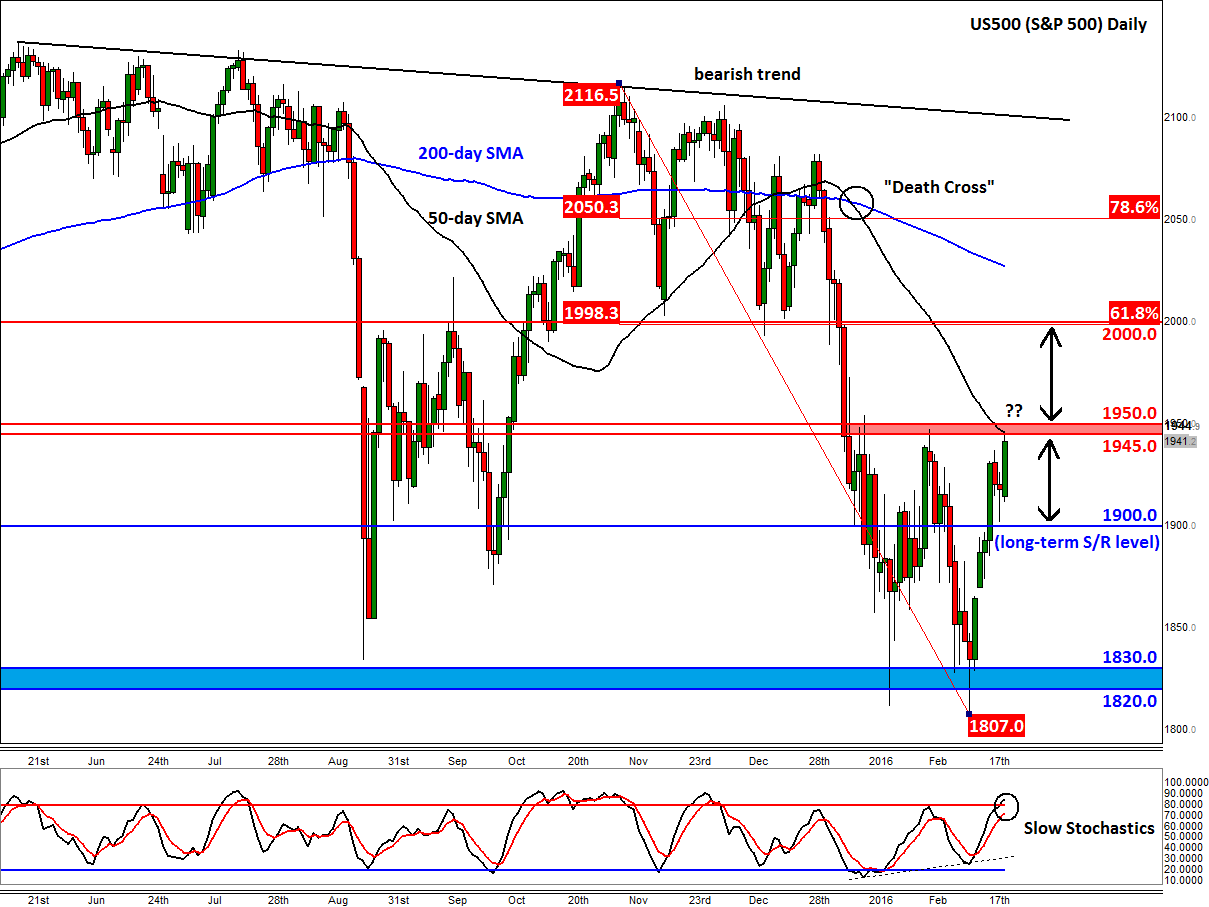
Today, we are taking a closer look at the technicals on the smaller daily time frame and we can refine our levels even more precisely. On this time frame, it is actually clear that the potential resistance is in the 1945-1950 range (as opposed to 1933-1950 on the weekly), an area which has been tested already today.
As well as the top of the recent range, the 50-day moving average also comes into play around this 1945-50 range. The last time the index tested this particular moving average was at the end of last year, which preceded that big drop. Since then, the 50- has moved below the 200-day average to create a so-called “death crossover.” When the averages are in this particular order, some trend followers tend to sell on rallies rather than buy the dips. That being said, some of the shorter-term and fast-moving exponential moving averages are now pointing higher because of the size of the rebound and also the amount of time the index has spent above the recent range lows. So, some of the bearish characterises that were relevant previously are now less relevant.
Nevertheless, with the S&P 500 testing the top its recent range and also the 50-day moving average, there is a possibility for at least a short-term pullback here, especially given the fact that the momentum indicator slow stochastics has also reached the ‘overbought’ threshold. If the index does retreat from here, the next stop could be the long-term pivotal level of 1900. Short-term speculators may also want to plot the Fibonacci retracement levels from the bounce at 1807 in order to see where some of the “invisible” levels of potential support reside. In any case, a move back below 1900 would be deemed a bearish outcome.
The bulls meanwhile would want to see a clean break above the 1945-1950 range. They are no doubt encouraged by the manner in which the market has rallied in recent times – with small pullbacks – and the fact that the key 1800-1830 support area has held firm several times now. It is also important to highlight a potentially significant reversal signal that may have occurred earlier in the month: a false break below the prior lows, confirmed by the momentum indicators making higher lows. But at this stage, this must only be treated as a potential, rather than actual, reversal signal for the reasons stated above.
In summary, there is a possibility for a move to the downside now that the S&P 500 has reached a potential resistance area around 1945-1950. However, if this area breaks down then there is just thin air until the next key resistance zone around 2000-2010 (this is where previous support meets the 61.8% Fibonacci retracement level), potentially leading to a sharp rally.
StoneX Financial Ltd (trading as “City Index”) is an execution-only service provider. This material, whether or not it states any opinions, is for general information purposes only and it does not take into account your personal circumstances or objectives. This material has been prepared using the thoughts and opinions of the author and these may change. However, City Index does not plan to provide further updates to any material once published and it is not under any obligation to keep this material up to date. This material is short term in nature and may only relate to facts and circumstances existing at a specific time or day. Nothing in this material is (or should be considered to be) financial, investment, legal, tax or other advice and no reliance should be placed on it.
No opinion given in this material constitutes a recommendation by City Index or the author that any particular investment, security, transaction or investment strategy is suitable for any specific person. The material has not been prepared in accordance with legal requirements designed to promote the independence of investment research. Although City Index is not specifically prevented from dealing before providing this material, City Index does not seek to take advantage of the material prior to its dissemination. This material is not intended for distribution to, or use by, any person in any country or jurisdiction where such distribution or use would be contrary to local law or regulation.
For further details see our full non-independent research disclaimer and quarterly summary.
CFDs are complex instruments and come with a high risk of losing money rapidly due to leverage. 69% of retail investor accounts lose money when trading CFDs with this provider. You should consider whether you understand how CFDs work and whether you can afford to take the high risk of losing your money. CFD and Forex Trading are leveraged products and your capital is at risk. They may not be suitable for everyone. Please ensure you fully understand the risks involved by reading our full risk warning.
City Index is a trading name of StoneX Financial Ltd. Head and Registered Office: 1st Floor, Moor House, 120 London Wall, London, EC2Y 5ET. StoneX Financial Ltd is a company registered in England and Wales, number: 05616586. Authorised and regulated by the Financial Conduct Authority. FCA Register Number: 446717.
City Index is a trademark of StoneX Financial Ltd.
The information on this website is not targeted at the general public of any particular country. It is not intended for distribution to residents in any country where such distribution or use would contravene any local law or regulatory requirement.
© City Index 2024