S amp P 500 set for positive start on last day of bad quarter
European and UK stocks are trading sharply higher on this last day of what has been a bad third quarter, raising suspicion that the markets may be rising because of “window dressing.” This is when fund managers buy stocks that have been performing well in order to make their portfolios look attractive, though Glencore, which has been absolutely battered of late, is up 10% after the company reassured investors that it is not going bust. As well as Glencore, the UK’s FTSE is led by supermarket shares after Sainsbury reported better than expected like-for-like sales in the second quarter. At the time of this writing, the FTSE is up 2% and similar gains are seen for Europe’s other major indices. US index futures currently point to a firmer open on Wall Street, with the S&P set to open one per cent higher, though this may change as investors react to the US ADP employment report which has just come out with a gain of 200,000 jobs.
Despite today’s gains the global stock markets have performed poorly in the third quarter. Sentiment has been rattled by signs of weakening global economic growth, most notably in China, which combined with a stronger dollar has raised serious question marks over the earnings outlook. Indeed, analysts have been continually reducing their expectations and now think US earnings will decline 4.5% in the third quarter compared to a year-earlier period while revenues would fall 3.3%, according to data from FactSet. If correct, revenues will have fallen for three straight quarters and it will be the first back-to-back quarters of declining earnings since 2009.
Japan’s Nikkei has had its worst three-month period since 2010 and Chinese stocks their worst since 2008 with a fall of almost 29% in the third quarter. The FTSE Emerging Index has plunged more than 21% in Q3, which is its worst quarter since 2011. In the US, the markets have been rising almost every year after hitting a post-crisis low in March 2009, thus it was only a matter of time before that trend ended. Though the year has not finished yet, stocks could fall this year as the Federal Reserve prepares to raise interest rates for the first time since 2006. For the quarter, the S&P 500 has so far fallen about 8, which is the biggest drop since the third quarter of 2011. As well as commodity-linked stocks, sectors that had led the market earlier this year, such as biotech and healthcare, have fallen dramatically in recent times.
Thus going into the fourth quarter, it is safe to say that sentiment is downbeat despite today’s rally. But how much of the negativity is already priced? Are the markets overreacting to the global growth concerns? Have the bears had enough? Or are we in for a much larger correction? There are so many questions, but some will be answered by this week’s key economic data releases from China, Japan, Europe and the US. The truth is that no one will know for sure when the markets will bottom out, and even though some major indices may have created potential reversal signals, such as double bottom on the German DAX index, this could prove to be a so-called suckers’ rally.
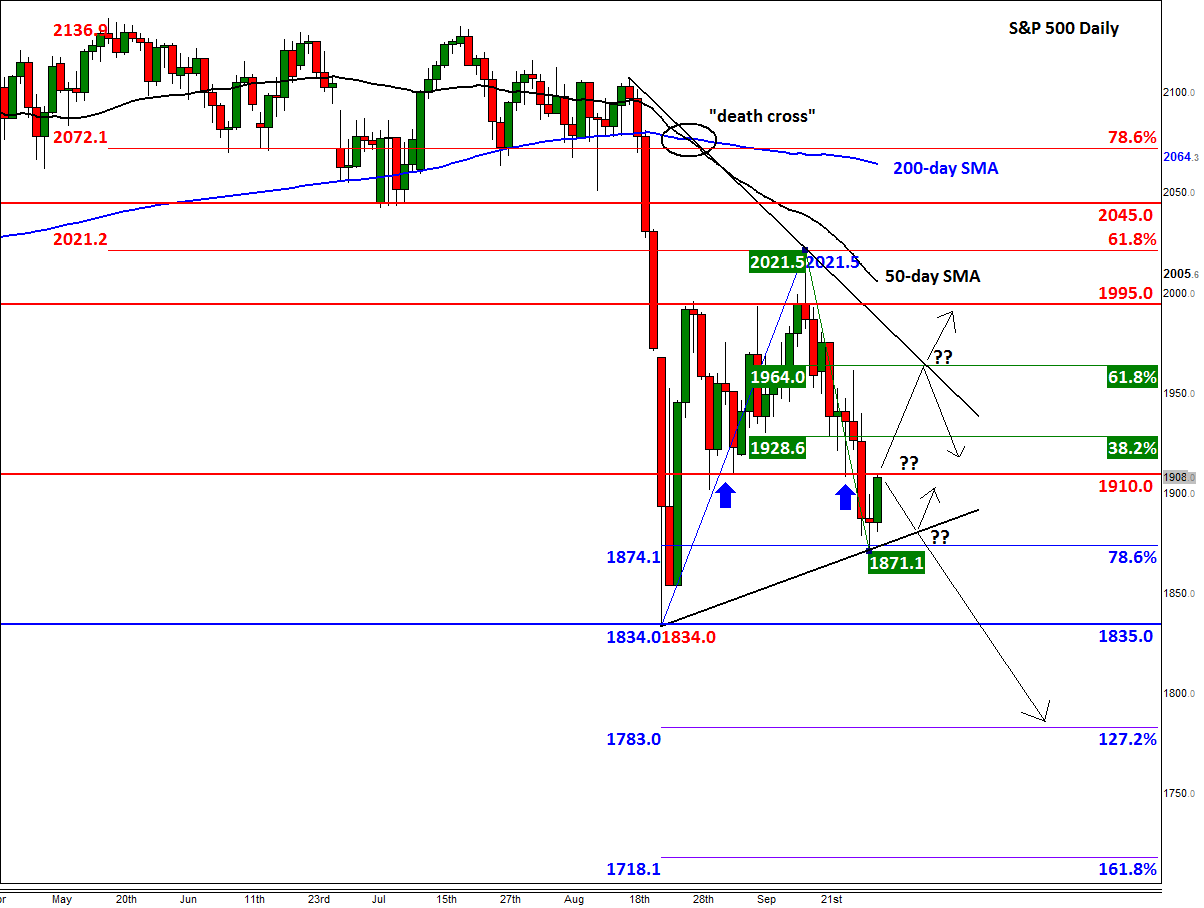
As far as the S&P is concerned, the index has bounced off the 78.6% Fibonacci retracement level of the upswing from the August low, at 1871. It is currently testing the previous support level around 1910, which could now turn into resistance and presage another sell-off. Things could then turn ugly if yesterday’s low of 1871 gets broken; in this scenario a move down to at least the August low of 1834 would be the most logical outcome. Alternatively, if the bulls take out the abovementioned 1910 resistance level then we may see a more significant rally towards the Fibonacci levels of the most recent downswing at 1928 (38.2%) or 1964 (61.8%), before the index decides on its next move. A particularly bullish outcome would be if the S&P also breaks above the bearish trend line, which comes in around that 1964 level. If seen, the index may potentially stage a sharp recovery towards its 200-day moving average, currently at 2064. For the time being though, we are giving the bears the benefit of the doubt and thus expect today’s rally to be short-lived.
StoneX Financial Ltd (trading as “City Index”) is an execution-only service provider. This material, whether or not it states any opinions, is for general information purposes only and it does not take into account your personal circumstances or objectives. This material has been prepared using the thoughts and opinions of the author and these may change. However, City Index does not plan to provide further updates to any material once published and it is not under any obligation to keep this material up to date. This material is short term in nature and may only relate to facts and circumstances existing at a specific time or day. Nothing in this material is (or should be considered to be) financial, investment, legal, tax or other advice and no reliance should be placed on it.
No opinion given in this material constitutes a recommendation by City Index or the author that any particular investment, security, transaction or investment strategy is suitable for any specific person. The material has not been prepared in accordance with legal requirements designed to promote the independence of investment research. Although City Index is not specifically prevented from dealing before providing this material, City Index does not seek to take advantage of the material prior to its dissemination. This material is not intended for distribution to, or use by, any person in any country or jurisdiction where such distribution or use would be contrary to local law or regulation.
For further details see our full non-independent research disclaimer and quarterly summary.
CFDs are complex instruments and come with a high risk of losing money rapidly due to leverage. 69% of retail investor accounts lose money when trading CFDs with this provider. You should consider whether you understand how CFDs work and whether you can afford to take the high risk of losing your money. CFD and Forex Trading are leveraged products and your capital is at risk. They may not be suitable for everyone. Please ensure you fully understand the risks involved by reading our full risk warning.
City Index is a trading name of StoneX Financial Ltd. Head and Registered Office: 1st Floor, Moor House, 120 London Wall, London, EC2Y 5ET. StoneX Financial Ltd is a company registered in England and Wales, number: 05616586. Authorised and regulated by the Financial Conduct Authority. FCA Register Number: 446717.
City Index is a trademark of StoneX Financial Ltd.
The information on this website is not targeted at the general public of any particular country. It is not intended for distribution to residents in any country where such distribution or use would contravene any local law or regulatory requirement.
© City Index 2024