S amp P 500 s post NFP reversal could be a bullish sign for the coming week
Without fail, some popular financial personality will jokingly tweet “Week’s over” (or even “Month’s over”) after the release of the monthly Non-Farm Payroll report. Traders who took this common tongue-in-cheek joke too literally this month will be in for a rude awakening when they turn their attention back to the markets.
By now, most readers know that this month’s jobs report was a big disappointment. Not only did the headline number of jobs miss expectations (142k vs. 201k anticipated), but the average hourly earnings reading and revisions were also negative as well (0.0% m/m and -59k jobs, respectively). This triple whammy of negative US data predictably drove the US dollar lower, equities down, and bonds through the roof as the market began to seriously question the likelihood of the Federal Reserve raising interest rates at all this year.
Over the last six hours though, every single one of those moves has faded in a classic post-NFP v-shaped reversal. For the uninitiated, this refers to the surprisingly common tendency for traders to initially overreact to a surprising NFP report before seeing the initial move unwind over the ensuing hours. As of writing, the US dollar index has fought its way back to nearly breakeven, bonds are seeing some of their early gains evaporate and US equities are actually trading higher on the day.
Technical View: S&P 500
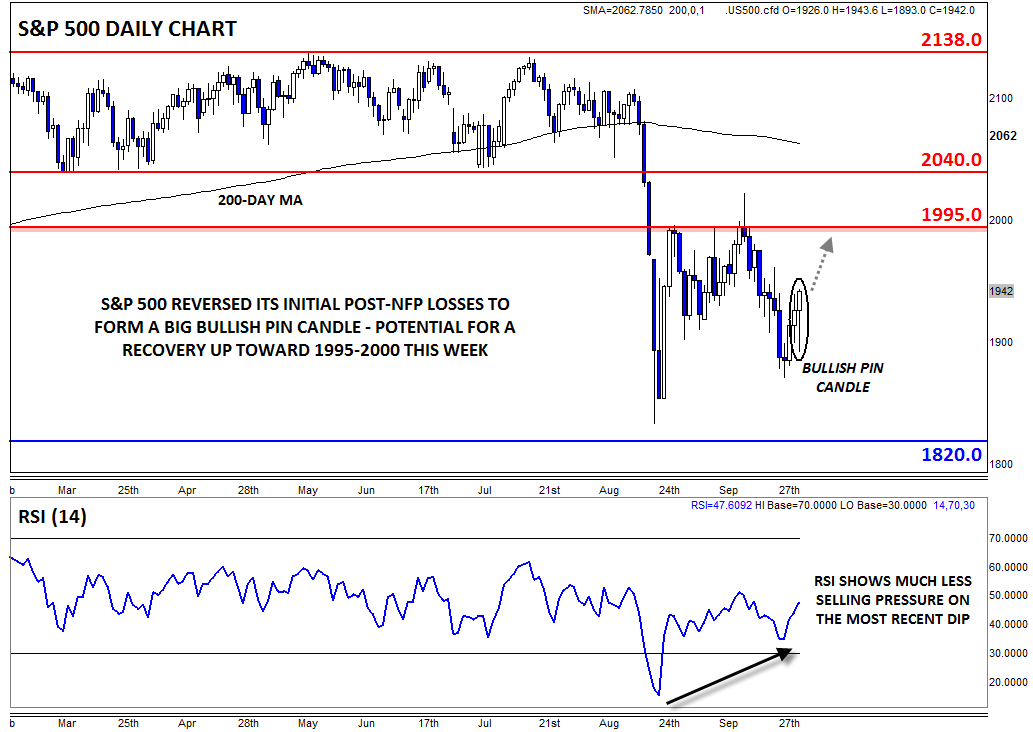
Focusing in on the S&P 500 reveals a very bullish candlestick in formation today. While it doesn’t come at the bottom of bearish move, it is very similar to a Bullish Pin Candle*, which shows an intraday shift from selling to buying pressure and often foreshadows more gains to come. Meanwhile, the selling momentum (as shown by the RSI indicator) has been much less severe on the most recent downswing.
With this week’s “retest” of the recent lows, US stocks may now rally back up toward the previous resistance zone in the 1995-2000 range. That said, there is plenty of overhead supply starting in that zone, so long-term bulls may want to tread with caution unless or until we can conclusively rally back above 2040. While not our base case, a break below this week’s low at 1870 would open the door for a move all the way back down toward the 1820-30 level, so the price action in the coming week will be critical.
* A Bullish Pin (Pinnochio) candle, also known as a hammer or paper umbrella, is formed when prices fall within the candle before buyers step in and push prices back up to close near the open. It suggests the potential for a bullish continuation if the high of the candle is broken.
StoneX Financial Ltd (trading as “City Index”) is an execution-only service provider. This material, whether or not it states any opinions, is for general information purposes only and it does not take into account your personal circumstances or objectives. This material has been prepared using the thoughts and opinions of the author and these may change. However, City Index does not plan to provide further updates to any material once published and it is not under any obligation to keep this material up to date. This material is short term in nature and may only relate to facts and circumstances existing at a specific time or day. Nothing in this material is (or should be considered to be) financial, investment, legal, tax or other advice and no reliance should be placed on it.
No opinion given in this material constitutes a recommendation by City Index or the author that any particular investment, security, transaction or investment strategy is suitable for any specific person. The material has not been prepared in accordance with legal requirements designed to promote the independence of investment research. Although City Index is not specifically prevented from dealing before providing this material, City Index does not seek to take advantage of the material prior to its dissemination. This material is not intended for distribution to, or use by, any person in any country or jurisdiction where such distribution or use would be contrary to local law or regulation.
For further details see our full non-independent research disclaimer and quarterly summary.
CFDs are complex instruments and come with a high risk of losing money rapidly due to leverage. 69% of retail investor accounts lose money when trading CFDs with this provider. You should consider whether you understand how CFDs work and whether you can afford to take the high risk of losing your money. CFD and Forex Trading are leveraged products and your capital is at risk. They may not be suitable for everyone. Please ensure you fully understand the risks involved by reading our full risk warning.
City Index is a trading name of StoneX Financial Ltd. Head and Registered Office: 1st Floor, Moor House, 120 London Wall, London, EC2Y 5ET. StoneX Financial Ltd is a company registered in England and Wales, number: 05616586. Authorised and regulated by the Financial Conduct Authority. FCA Register Number: 446717.
City Index is a trademark of StoneX Financial Ltd.
The information on this website is not targeted at the general public of any particular country. It is not intended for distribution to residents in any country where such distribution or use would contravene any local law or regulatory requirement.
© City Index 2024