S amp P 500 s Head and Shoulders pattern point to further weakness
It has been an ugly day for stock market bulls and things get even worse if the major indices fail to hold their technically-important levels that are being tested as I go to press. The falling commodity prices have finally taken their toll on the markets today, with concerns over an imminent rate hike from the Federal Reserve also unnerving some people. Recent macroeconomic pointers from China, including Wednesday’s factory output data, which showed activity slowed to a seven month low of 5.6% in October, continue to suggest growth in the world’s second largest economy is slowing down. In the US, the earnings season is drawing to a close and the results have not been great. There is little further catalyst to support the markets except the on-going expectations that the world’s major central banks will remain extremely accommodative for an extended period of time, and in the case of the ECB expand their bond purchases program and cut rates into the negative.
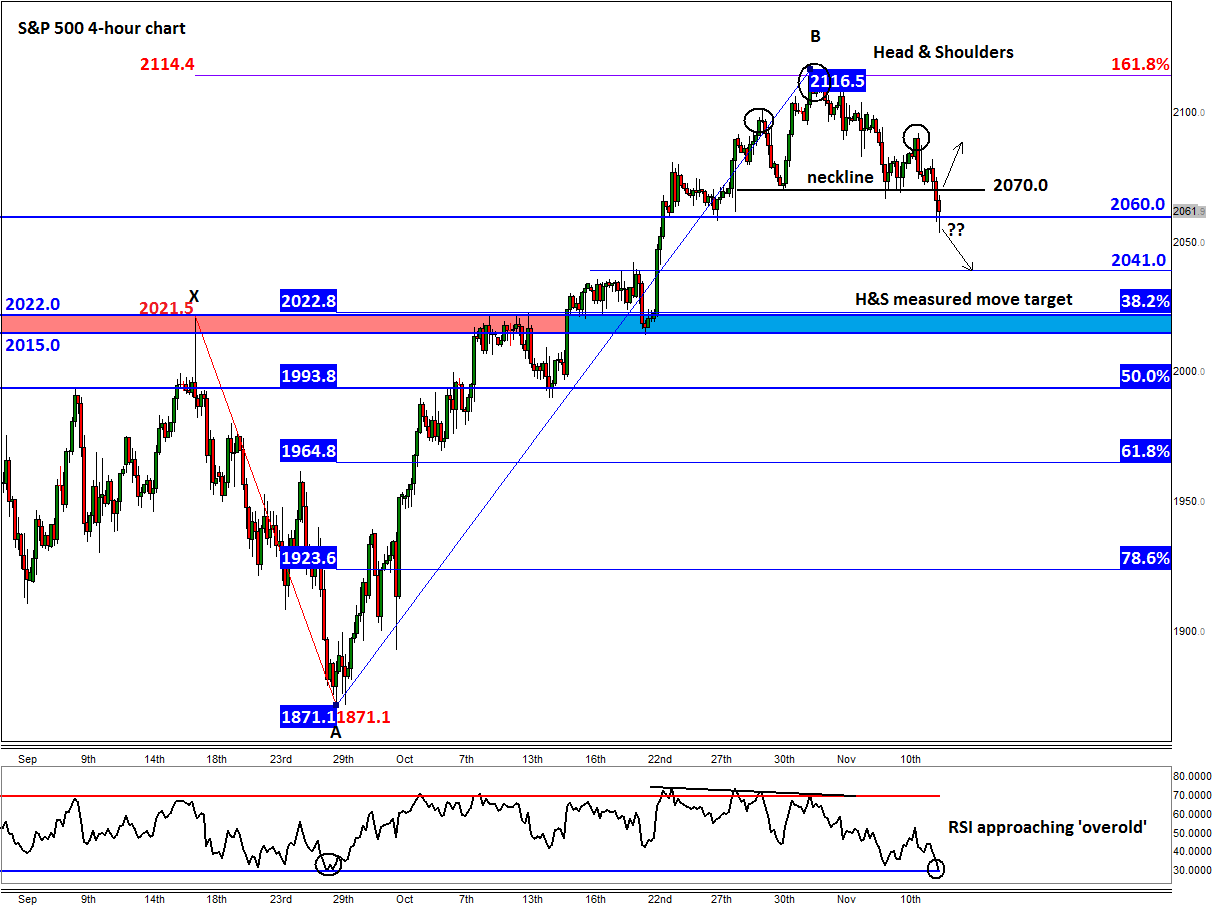
But focusing on the technical outlook of the markets today and the bears are clearly starting to once again win back control – at least in the short-term anyway. The S&P 500’s rally has stalled at the start of this month around the 161.8% Fibonacci exhaustion point of the last notable downswing we observed in September, around 2114/6. Here, bullish traders evidently took profit on their positions, particularly as the momentum indicator RSI had correspondingly been testing overbought levels of 70 and created a bearish divergence. This probably applied some downward pressure, giving the sellers some much-needed confidence.
The resulting selling pressure has now created a potential reversal pattern on the S&P: a Head and Shoulders (H&S) formation. As can be seen from the 4-hour chart, the ‘head’ was formed around the 161.8% extension of the XA price swing of 2114/6, while the neckline was formed at 2070. Today, the S&P has broken below the neckline and is now testing another support at 2060. It needs to break decisively below here now in order to confirm the turnaround. The height of the H&S pattern is thus about 46 points (2116-2070). This gives us a projected target of about 2024 (2070-46). Interestingly, the next key support area is between 2015 and 2022, which therefore comes in just below the H&S target. It is therefore likely that the S&P will at the very least stage a modest bounce around these levels, should it get there. A move below this area would thus be very bearish and could lead to a significant drop. Standing on the way of the H&S target is the previous resistance at 2040/1, which could now turn into support.
The bulls, meanwhile, will first and foremost want to see a close back above the 2060 support level, and ideally a decisive break above the neckline at 2070. If seen, the S&P may then resume its rally towards the previous all-time high.
StoneX Financial Ltd (trading as “City Index”) is an execution-only service provider. This material, whether or not it states any opinions, is for general information purposes only and it does not take into account your personal circumstances or objectives. This material has been prepared using the thoughts and opinions of the author and these may change. However, City Index does not plan to provide further updates to any material once published and it is not under any obligation to keep this material up to date. This material is short term in nature and may only relate to facts and circumstances existing at a specific time or day. Nothing in this material is (or should be considered to be) financial, investment, legal, tax or other advice and no reliance should be placed on it.
No opinion given in this material constitutes a recommendation by City Index or the author that any particular investment, security, transaction or investment strategy is suitable for any specific person. The material has not been prepared in accordance with legal requirements designed to promote the independence of investment research. Although City Index is not specifically prevented from dealing before providing this material, City Index does not seek to take advantage of the material prior to its dissemination. This material is not intended for distribution to, or use by, any person in any country or jurisdiction where such distribution or use would be contrary to local law or regulation.
For further details see our full non-independent research disclaimer and quarterly summary.
CFDs are complex instruments and come with a high risk of losing money rapidly due to leverage. 69% of retail investor accounts lose money when trading CFDs with this provider. You should consider whether you understand how CFDs work and whether you can afford to take the high risk of losing your money. CFD and Forex Trading are leveraged products and your capital is at risk. They may not be suitable for everyone. Please ensure you fully understand the risks involved by reading our full risk warning.
City Index is a trading name of StoneX Financial Ltd. Head and Registered Office: 1st Floor, Moor House, 120 London Wall, London, EC2Y 5ET. StoneX Financial Ltd is a company registered in England and Wales, number: 05616586. Authorised and regulated by the Financial Conduct Authority. FCA Register Number: 446717.
City Index is a trademark of StoneX Financial Ltd.
The information on this website is not targeted at the general public of any particular country. It is not intended for distribution to residents in any country where such distribution or use would contravene any local law or regulatory requirement.
© City Index 2024