S amp P 500 Mixed earnings season builds anticipation for big breakout
The Q2 US earnings season is now in its home stretch, and the companies that make up the S&P 500 index are on track to put in a mixed performance, though not as bad as many analysts had feared.
As of writing, 452 (90%) of the 500 companies have reported, with 327 (72%) beating their earnings estimates; this impressive-sounding figure is actually in-line with the 5-year average (73%) as companies are known for massaging analysts’ estimates down to a beatable level in most cases. Perhaps more significantly, only 225 (50%) of the reporting companies have beat their top-line sales estimates, below the 5-year historical rate of 57%.
According to the earnings mavens at FactSet, the blended (actual results from companies that have reported combined with estimated results for companies yet to report) earnings decline is -1.0% for the quarter and the blended revenue decline is -3.3%. If the remaining results come in roughly as expected, the S&P 500 would see its first year-over-year decline in earnings since 2012 and its first consecutive decrease in revenue since 2009. While declining earnings and revenue across 500 of the largest companies in the world’s largest economy is hardly a good thing, many traders had feared worse, so the S&P 500 has been able to hold its ground around the 2100 level of late (see below).
From our view, there are three major themes driving the Q2 results. The first factor is slowing growth in Asia. With growth in China, the world’s second-largest economy, on track to dip below 7.0% for the first time since the Great Recession, many of the large multinational companies are seeing a notable dip in their sales to entire Asian-Pacific region. Beyond the slowing economy overseas, the roughly 20% increase in the value of the US dollar index relative to last year is also hurting the sales of multinational companies that did not aggressively hedge their international exposure. Related to both of the above themes, the big decline in oil from this period in 2014 continues to ravage the performance of energy companies, though the cheaper oil prices has benefitted some manufacturers and consumer-oriented companies. Looking ahead, these factors have hardly eased thus far in Q3, and many analysts expect aggregate declines in year-over-year revenues to extend throughout the rest of 2015.
Technical view: S&P 500
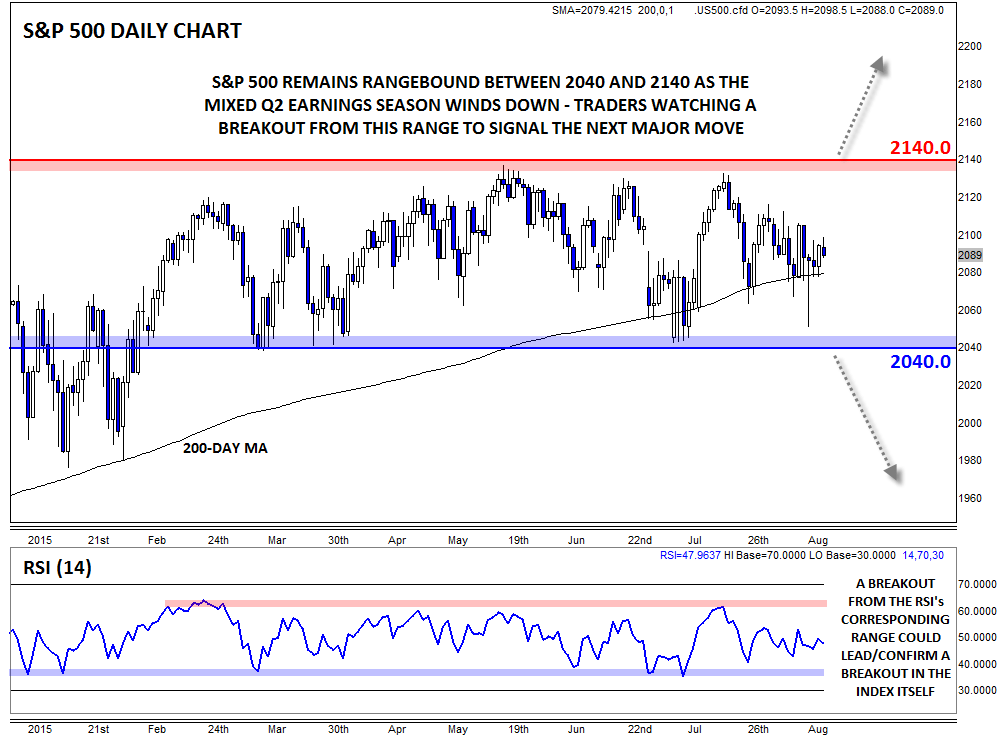
As for the performance of the S&P 500 itself, the index has lost any semblance of volatility or a meaningful trend. Prices have been contained to a historically tight 100-point range from 2040 up to 2140 for more than six months now, frustrating both bulls and bears. Though there has been some notable deterioration under-the-surface in internal measures like breadth and sector rotation, the index remains stable. Not surprisingly, the daily RSI indicator has also carved out a firm range between about 36 and 62.
At this point, longer-term traders may want to wait for a conclusive breakout before committing to either new long or short trades. A break above 2140, ideally accompanied by a breakout in the RSI indicator, would signal that the long-term uptrend has resumed for a possible move up toward 2200 or higher, whereas a breakdown below 2040 (and a corresponding drop in the RSI indicator) may signal a deeper retracement toward the 1900 level is possible.
StoneX Financial Ltd (trading as “City Index”) is an execution-only service provider. This material, whether or not it states any opinions, is for general information purposes only and it does not take into account your personal circumstances or objectives. This material has been prepared using the thoughts and opinions of the author and these may change. However, City Index does not plan to provide further updates to any material once published and it is not under any obligation to keep this material up to date. This material is short term in nature and may only relate to facts and circumstances existing at a specific time or day. Nothing in this material is (or should be considered to be) financial, investment, legal, tax or other advice and no reliance should be placed on it.
No opinion given in this material constitutes a recommendation by City Index or the author that any particular investment, security, transaction or investment strategy is suitable for any specific person. The material has not been prepared in accordance with legal requirements designed to promote the independence of investment research. Although City Index is not specifically prevented from dealing before providing this material, City Index does not seek to take advantage of the material prior to its dissemination. This material is not intended for distribution to, or use by, any person in any country or jurisdiction where such distribution or use would be contrary to local law or regulation.
For further details see our full non-independent research disclaimer and quarterly summary.
CFDs are complex instruments and come with a high risk of losing money rapidly due to leverage. 69% of retail investor accounts lose money when trading CFDs with this provider. You should consider whether you understand how CFDs work and whether you can afford to take the high risk of losing your money. CFD and Forex Trading are leveraged products and your capital is at risk. They may not be suitable for everyone. Please ensure you fully understand the risks involved by reading our full risk warning.
City Index is a trading name of StoneX Financial Ltd. Head and Registered Office: 1st Floor, Moor House, 120 London Wall, London, EC2Y 5ET. StoneX Financial Ltd is a company registered in England and Wales, number: 05616586. Authorised and regulated by the Financial Conduct Authority. FCA Register Number: 446717.
City Index is a trademark of StoneX Financial Ltd.
The information on this website is not targeted at the general public of any particular country. It is not intended for distribution to residents in any country where such distribution or use would contravene any local law or regulatory requirement.
© City Index 2024