S amp P 500 Massive long term support zone under threat
At the beginning of last week, we provided a “check-up” midway through the Q4 earnings season for the S&P 500, concluding that the four biggest themes were “falling earnings and sales, weak performance out of the energy sector, continued improvement in margins, and the dramatic impact of the US Dollar.” We’ll provide a full summary of the reports when earnings season is winding down, but once again, it looks like large US companies will see a decline in aggregate earnings and revenues.
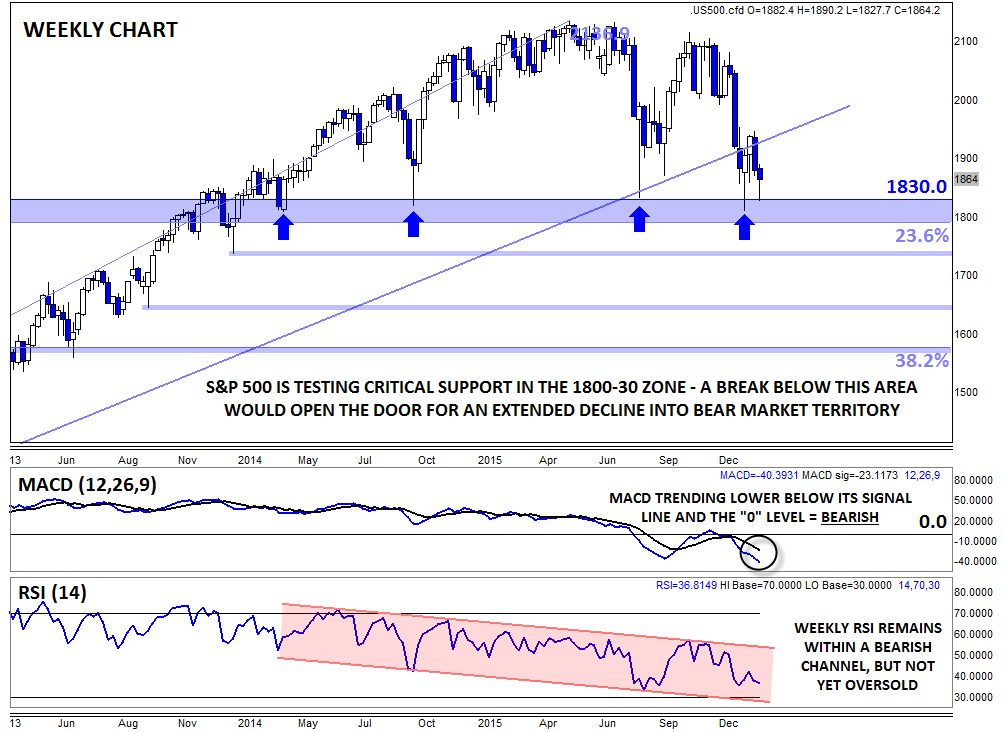
At the moment though, the more pressing issue is the technical picture. After the big drop to start the year, the S&P 500 has now broken below the nearly 7-year bullish trend line (arithmetic chart) off the 2009 lows and is testing a critical support area in the lower-1800s. This zone represents the previous lows from April 2014, October 2014, August 2015, and January of this year, as well as the 23.6% Fibonacci retracement of the whole 2009-2015 rally (1791). Bulls would argue that we’ve seen meaningful rallies the last four times we tested this support zone, though bears would be quick to note that the magnitude of those rallies has been declining (from a 300+ point move in 2014-2015 to a 280 point rally last year to just a 135 point rally over the last few weeks before we rolled over once again).
Not only are we seeing less and less conviction on each subsequent rally off the 1800 support zone, but the secondary indicators on the weekly chart are also more bearish than they’ve been in years. For one, the weekly MACD indicator is trending sharply lower below both its signal line and the “0” level, showing growing bearish momentum. Meanwhile, the weekly RSI remains within a 2-year bearish channel and is not even in oversold territory, suggesting that the index could fall further if 1800 support gives way.
Below 1800, there’s not much in the way of meaningful support until down around 1600; that said, we could see buyers step in around the minor lows at 1740 (Feb 2014) or 1640 (Aug-Oct 2013) along the way. Of course, betting against the long-term uptrend in stocks has been a fool’s errand over the last half-decade or so, so bears may opt to cut losses quickly, especially if the S&P 500 recovers back above last week’s high and the broken bullish trend line in the 1950 region.
StoneX Financial Ltd (trading as “City Index”) is an execution-only service provider. This material, whether or not it states any opinions, is for general information purposes only and it does not take into account your personal circumstances or objectives. This material has been prepared using the thoughts and opinions of the author and these may change. However, City Index does not plan to provide further updates to any material once published and it is not under any obligation to keep this material up to date. This material is short term in nature and may only relate to facts and circumstances existing at a specific time or day. Nothing in this material is (or should be considered to be) financial, investment, legal, tax or other advice and no reliance should be placed on it.
No opinion given in this material constitutes a recommendation by City Index or the author that any particular investment, security, transaction or investment strategy is suitable for any specific person. The material has not been prepared in accordance with legal requirements designed to promote the independence of investment research. Although City Index is not specifically prevented from dealing before providing this material, City Index does not seek to take advantage of the material prior to its dissemination. This material is not intended for distribution to, or use by, any person in any country or jurisdiction where such distribution or use would be contrary to local law or regulation.
For further details see our full non-independent research disclaimer and quarterly summary.
CFDs are complex instruments and come with a high risk of losing money rapidly due to leverage. 69% of retail investor accounts lose money when trading CFDs with this provider. You should consider whether you understand how CFDs work and whether you can afford to take the high risk of losing your money. CFD and Forex Trading are leveraged products and your capital is at risk. They may not be suitable for everyone. Please ensure you fully understand the risks involved by reading our full risk warning.
City Index is a trading name of StoneX Financial Ltd. Head and Registered Office: 1st Floor, Moor House, 120 London Wall, London, EC2Y 5ET. StoneX Financial Ltd is a company registered in England and Wales, number: 05616586. Authorised and regulated by the Financial Conduct Authority. FCA Register Number: 446717.
City Index is a trademark of StoneX Financial Ltd.
The information on this website is not targeted at the general public of any particular country. It is not intended for distribution to residents in any country where such distribution or use would contravene any local law or regulatory requirement.
© City Index 2024