S amp P 500 fatigued US stocks due a correction
US equities have started the new trading week on a negative note, tracking the overnight losses seen in Europe and Asia. Investors don’t appear to be taking on much risk ahead of key US earnings, important economic data and a couple of central bank meetings this week. The drop in commodity prices like copper and oil are also holding back some stocks. Things could look and feel a lot different once investors digest some US earnings and data later on in the week. But right now, the markets do appear a little fatigued and a correction of some sort would not come as a surprise to me.
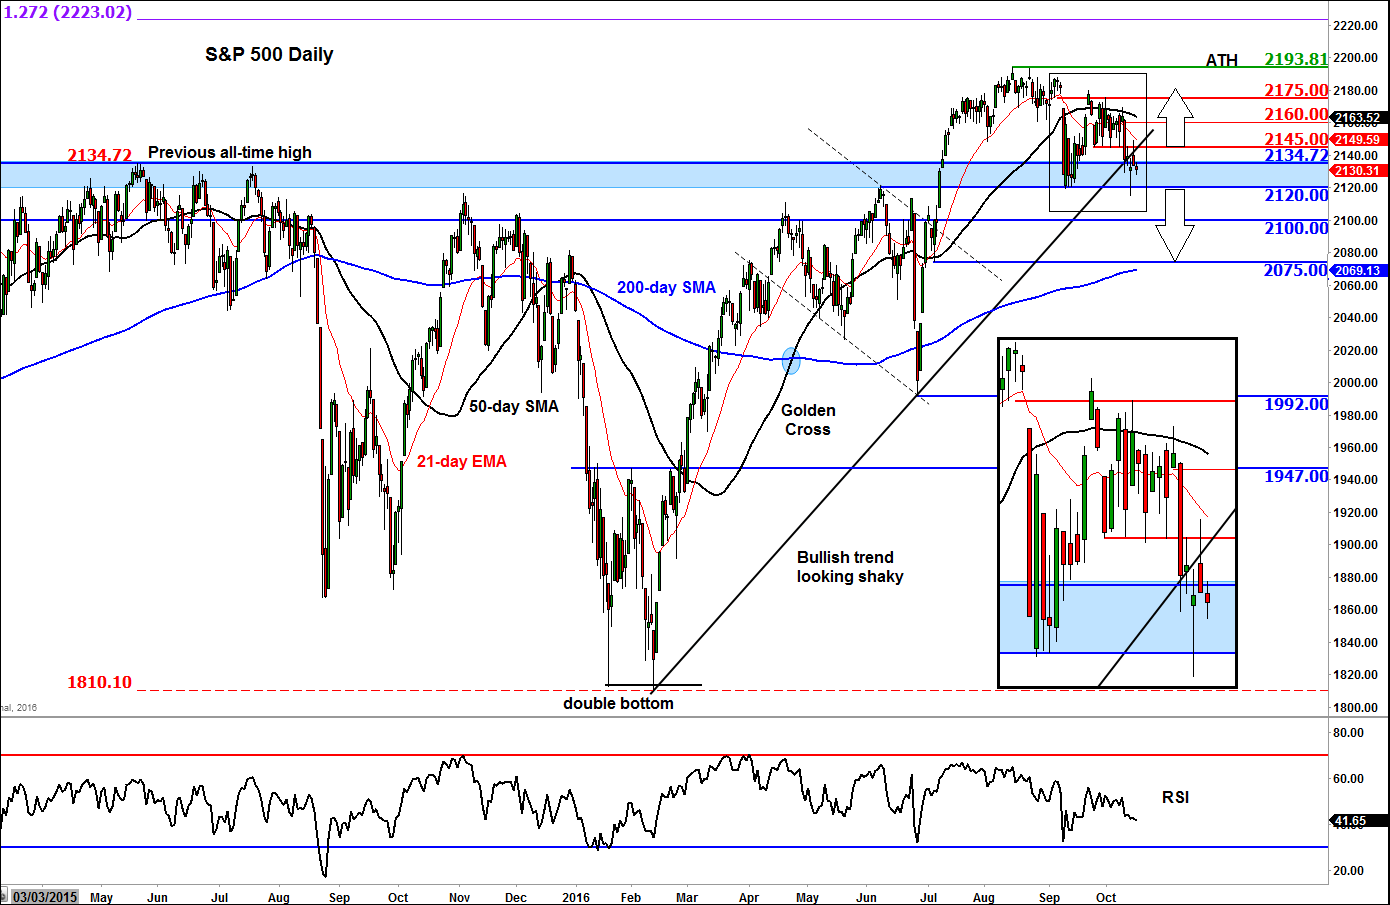
Indeed, that is exactly what the daily chart of the S&P 500, below, is pointing to. After the index broke to new unchartered territories back in July following a 1.5-year consolidation, one would have expected to see some strong follow-though in the upward direction. Instead, it had a bit of an anti-climax feeling to it. A new record high was achieved at 2198/4 in mid-August but since then the S&P has been trading in a range, mostly lower. The S&P has dropped to test the point of origin of the breakout at 2120 and the prior record high of 2134/5 several times now. So far, the buyers have stepped in, as you would expect, to push the market back into the range. However the bounces have been shallower each time. Now the more a level is tested, the more likely it is that it will break in the direction of the test. So, if the S&P were to test the 2120 support level again, it may fail to bounce this time. If so, a sharp withdrawal of bids may be the outcome, and mostly likely some fresh selling, too. The bears will be encouraged by the fact that a bullish trend line has now been eroded while the 21-day exponential moving average has crossed below the 50-day simple moving average. This is a clear warning sign for the bulls.
For now though, the bulls are still hanging in there and in the short-term they will be content for as long as the 2120 level holds on a daily closing basis. The slightly longer-term focused bulls will be happy for as long as the S&P remains above the rising 200-day moving average, which comes in at just shy of 2070. But there is a bit of a room between where we are at the moment and the 200 MA. So could the sellers take us down to that level? At this point, a closing break above the 2145 resistance (old support) level would tip the balance back in bulls’ favour. In this potential scenario, the odds that we will see new record highs would dramatically increase in my view.
StoneX Financial Ltd (trading as “City Index”) is an execution-only service provider. This material, whether or not it states any opinions, is for general information purposes only and it does not take into account your personal circumstances or objectives. This material has been prepared using the thoughts and opinions of the author and these may change. However, City Index does not plan to provide further updates to any material once published and it is not under any obligation to keep this material up to date. This material is short term in nature and may only relate to facts and circumstances existing at a specific time or day. Nothing in this material is (or should be considered to be) financial, investment, legal, tax or other advice and no reliance should be placed on it.
No opinion given in this material constitutes a recommendation by City Index or the author that any particular investment, security, transaction or investment strategy is suitable for any specific person. The material has not been prepared in accordance with legal requirements designed to promote the independence of investment research. Although City Index is not specifically prevented from dealing before providing this material, City Index does not seek to take advantage of the material prior to its dissemination. This material is not intended for distribution to, or use by, any person in any country or jurisdiction where such distribution or use would be contrary to local law or regulation.
For further details see our full non-independent research disclaimer and quarterly summary.
CFDs are complex instruments and come with a high risk of losing money rapidly due to leverage. 69% of retail investor accounts lose money when trading CFDs with this provider. You should consider whether you understand how CFDs work and whether you can afford to take the high risk of losing your money. CFD and Forex Trading are leveraged products and your capital is at risk. They may not be suitable for everyone. Please ensure you fully understand the risks involved by reading our full risk warning.
City Index is a trading name of StoneX Financial Ltd. Head and Registered Office: 1st Floor, Moor House, 120 London Wall, London, EC2Y 5ET. StoneX Financial Ltd is a company registered in England and Wales, number: 05616586. Authorised and regulated by the Financial Conduct Authority. FCA Register Number: 446717.
City Index is a trademark of StoneX Financial Ltd.
The information on this website is not targeted at the general public of any particular country. It is not intended for distribution to residents in any country where such distribution or use would contravene any local law or regulatory requirement.
© City Index 2024